The Last Straw
Understanding Today’s Challenging Market Landscape

Hello Everyone!
In this short article, I’ll be breaking down why the current market conditions are some of the toughest we’ve seen in quite some time.
We’ve been closely monitoring several technical factors that have been holding a firm bid under the current market valuation. These dynamics matter because, ultimately, price movements come from real decision-making by rational market participants. There’s no hidden, irrational force on the other side of a candlestick. Just traders and investors reacting to risk, data, and incentives.
Float is being artificially reduced
For a while now, we have maintained that the worldwide rotation into U.S. equities, especially tech and the S&P 500, is contributing to reduced float, which in turn may be interfering with efficient price discovery.
Specifically because the portion of the float that actively participates in price discovery is significantly smaller and thus marginal flows will have higher impacts on price.
The core idea is that flow-driven price impact does not scale linearly with market cap, especially under current market conditions.
Leverage is at All Time Highs
Whether it comes from record margin loans, Yen Funded carry trade or an options market exploding in short-dated contracts, there are several red lights flashing at the same time.
These extreme volumes in ultra–short-dated options now represent most of the notional traded and they suppress volatility through market-maker hedging dynamics (…and maybe some other abusive practices). These dynamics were first studied in 1972, when the options market was far smaller, and were classified as a form of “mini manipulation” (yes, this is the technical term). In my view there is nothing mini about them anymore.
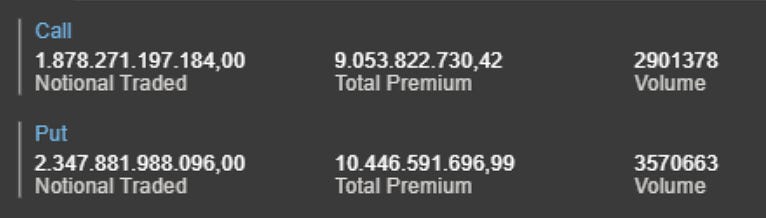
Just today we saw record levels of activity: more than $4 trillion in notional traded and over 6 million SPX option contracts changing hands.
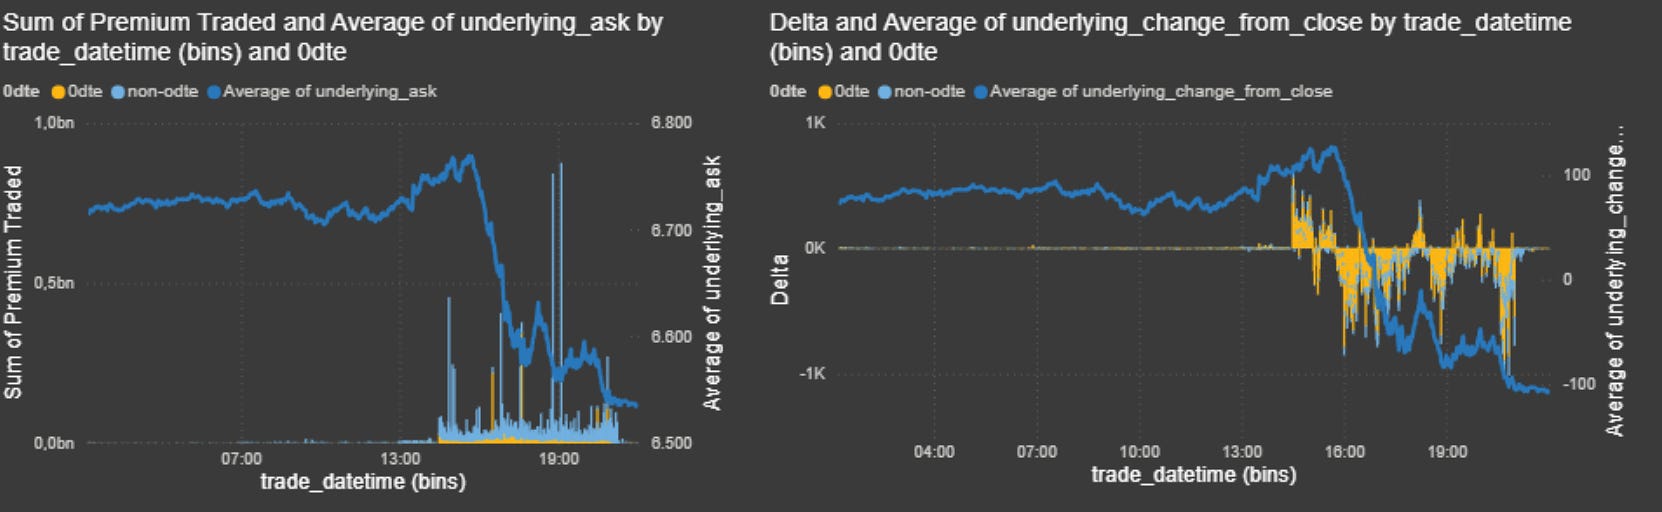
Even though most of the premium in the options market is traded outside of 0DTE contracts, the majority of the delta intraday exposure traded comes from 0DTE by a very wide margin. That alone shows how much leverage is embedded in the system. A near-expiry 0dte SPX option priced around one percent at the money can cost roughly 100$ while giving control over as much as 650 000$ of underlying. Pretty good right?
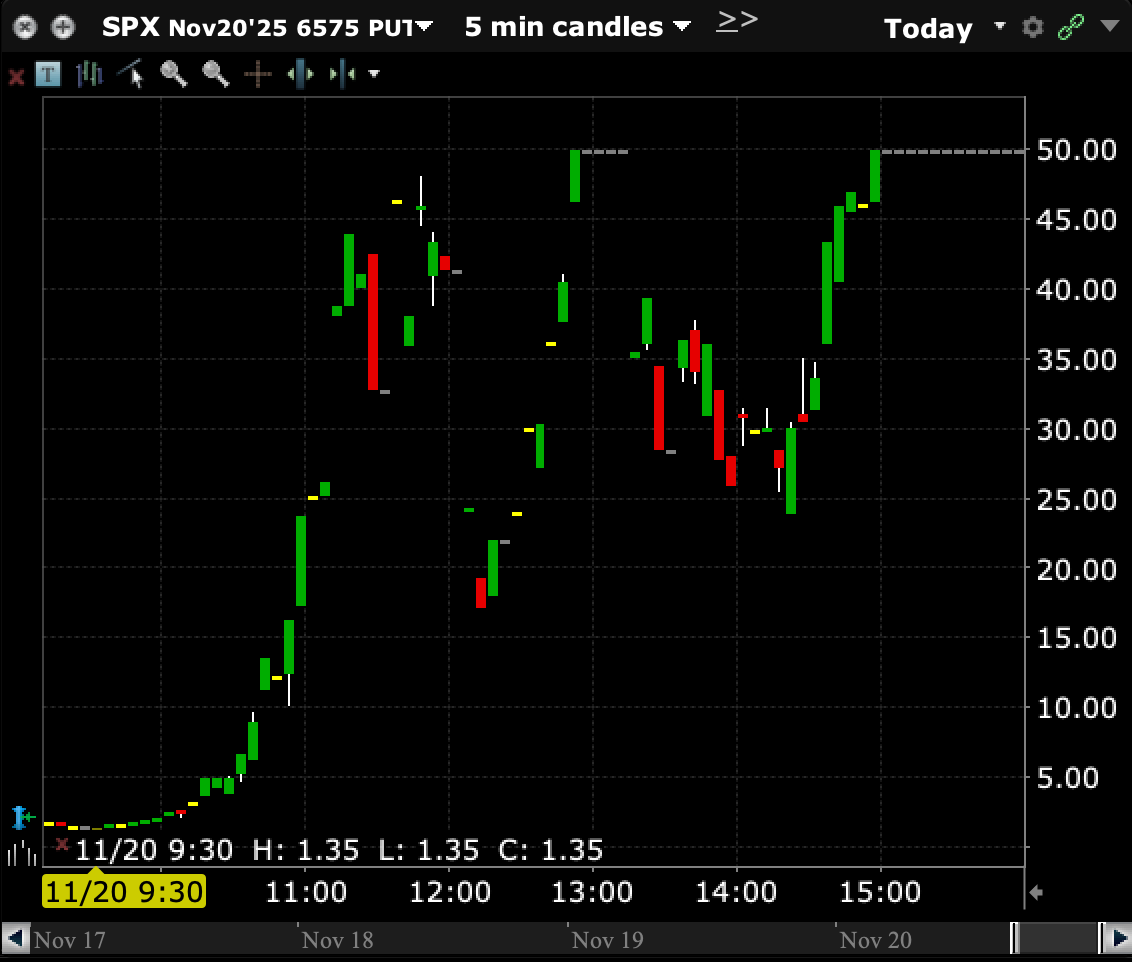
Thats how contracts like this can go from 135$ in the morning and end the day at 5000$+.
Just as a reminder, here are the latest debit customer balances reported by FINRA.
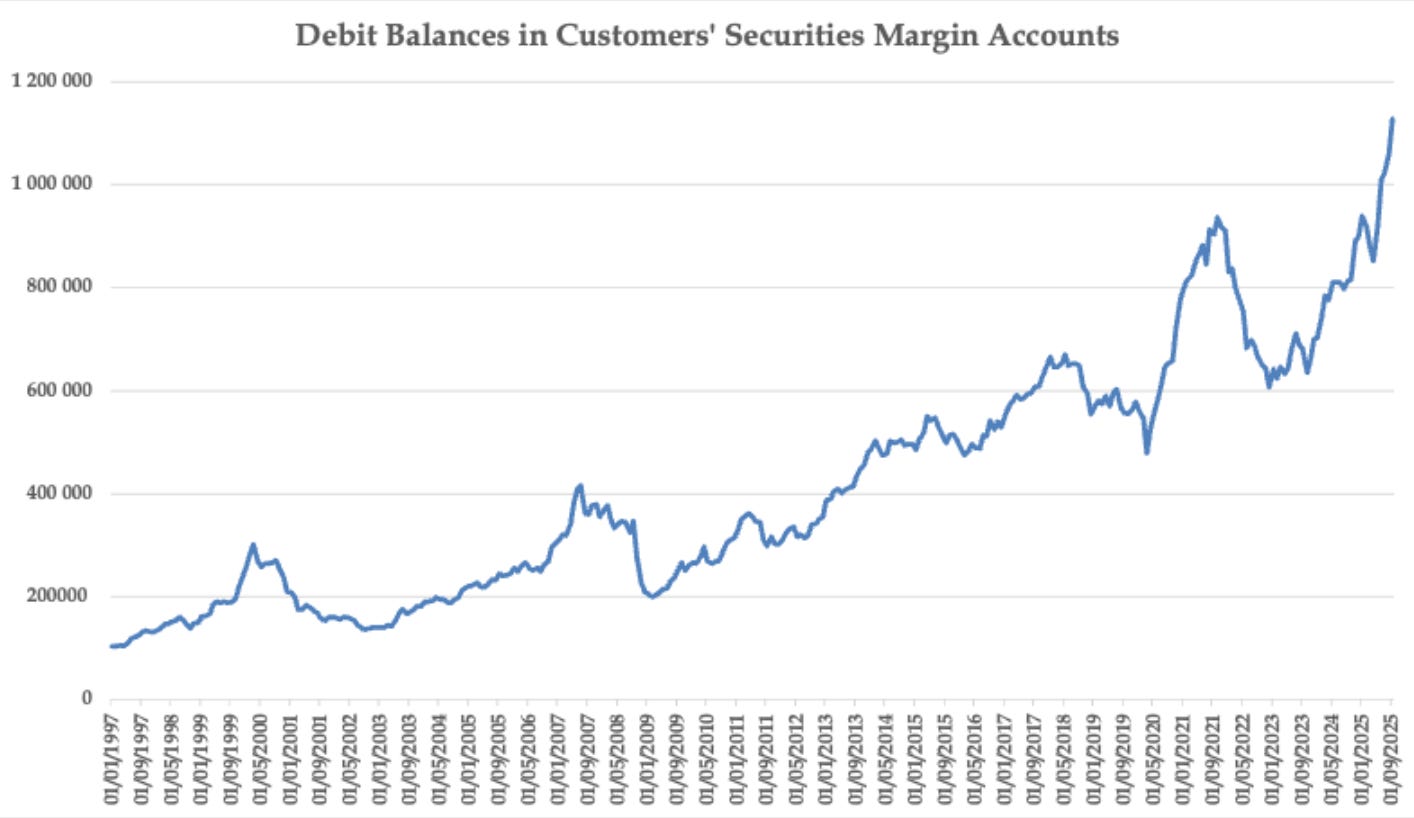
Margin loans are now at a record high! FINRA data show U.S. margin debt reached over $1.1 trillion in October 2025 alone. Meanwhile Interactive Brokers Chairman has publicly warned about the risk of a “disorderly unwinding” of highly-levered positions in equities and options.
Hot Potato Problem
Considering everything mentioned before, and the fact that calling this a bubble is now basically mainstream, why do economic agents still keep bidding at these valuations?
Simple. If you offer me cheap insurance against a major drawdown, I will gladly stay in the game. Think about it the same way you would treat a supercar. Would you rent a Bugatti for a day without full-coverage insurance? Probably not. But if the full insurance were cheap, you would not think twice.
The same logic applies here. Valuations are stretched and everyone knows it, but if downside protection is/WAS? affordable, people are happy to pay to play. A small insurance premium, limited downside, and full participation in the rally.
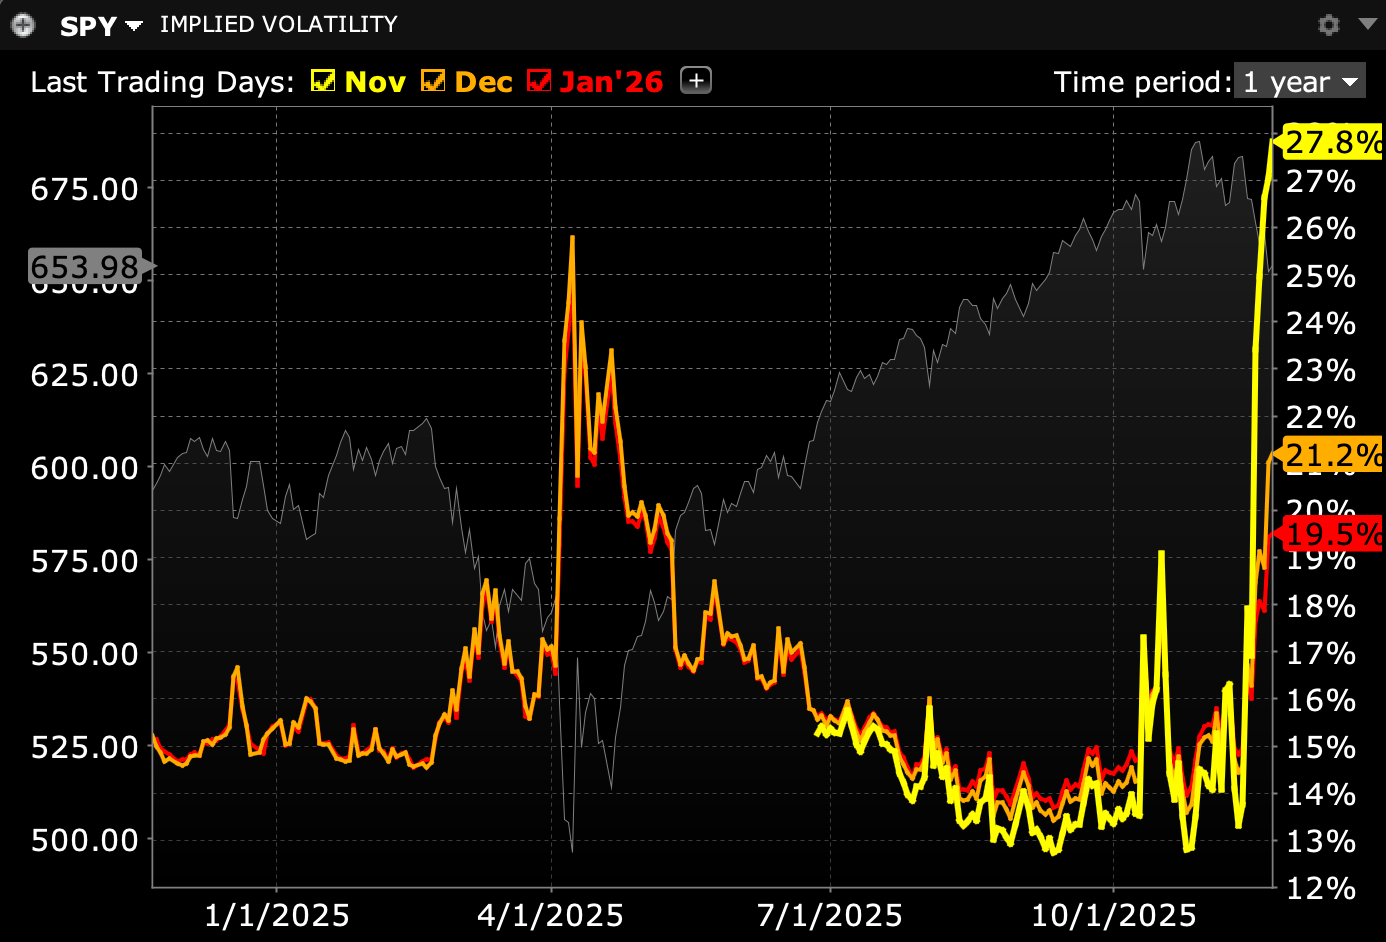
They ain’t lookin’ cheap now, matey!
If you were thinking of renting the Bugatti tomorrow too, maybe you’ll think twice.
HODL the SP500! … And Hubris
We’ve been at a very low volatility environment and a record performance of the stock market for over the last 10+ years and the debasement narrative creates a sense of security in Long Term performance - while underestimating volatility and most importantly the state of the economy.
To add to this, the last three major market corrections all produced rapid V-shaped recoveries. Even the 2022 downturn, which lasted longer, reversed quickly once the GPT cycle began and the strong dollar global carry trade kicked in. This reinforces the belief that corrections appear suddenly and disappear just as fast! Fast here is the key word.
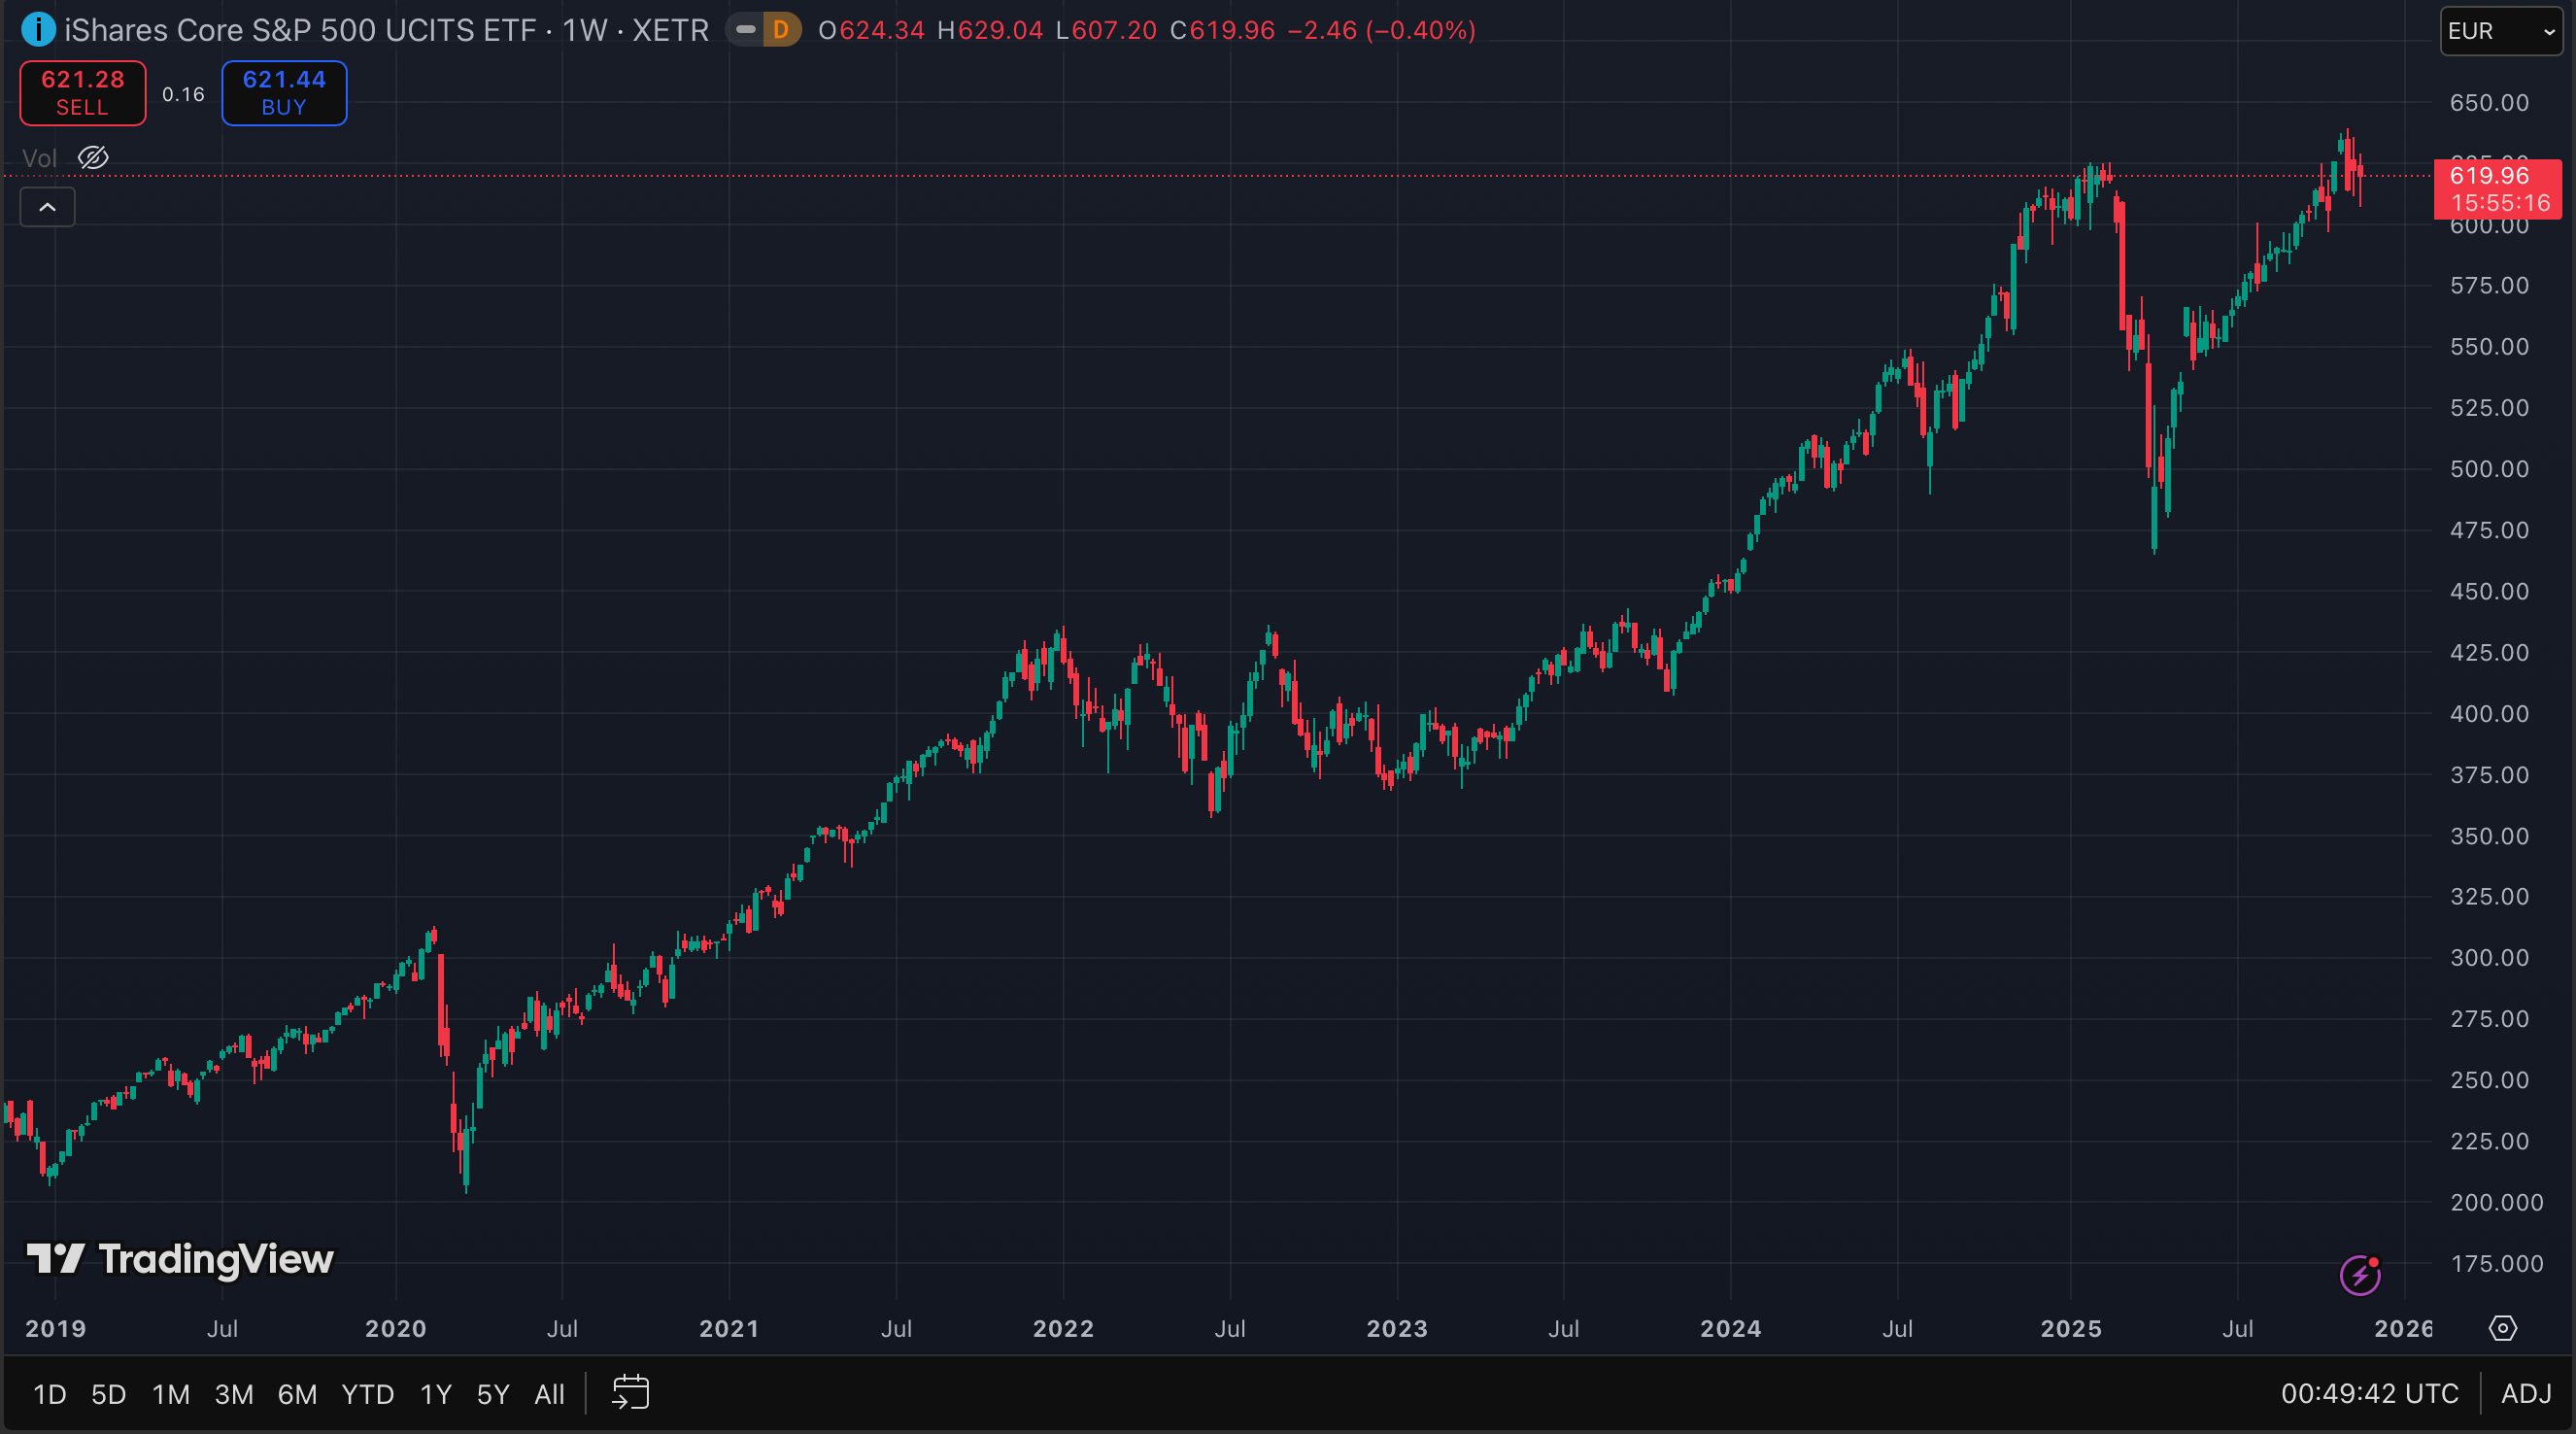
And even in 2022, European investors barely felt the correction because the dollar was so strong.
Do not get me wrong. I do believe monetary debasement is here to stay and that we are probably moving toward some form of dual-currency system over time. My issue with today’s market is the combination of stretched valuations supported by thin liquidity, technical flows and the risk that a global slowdown could force a wave of investors to raise cash after convincing themselves they would never sell their S&P 500 shares.
Employees and companies have lived through fifteen years of economic support in the US and EU, with governments spending aggressively and central banks keeping money close to free. The system made it through lockdowns without collapsing. Environments like this tend to produce bad habits in consumption, business discipline, investment decisions.. but above all.. Expectations! Specifically when it comes to employment.
Lets do some back of the envelope calculations.. the group most vulnerable to unemployment shocks and liquidity stress is the bottom-90% that hold 10% of the wealth. Using the TIC survey for foreign ownership, Europe holds about $8.1 trillion in US equities, Japan holds just under $1 trillion, and the total US equity market stands around $67 trillion.
If we assume that three in five families of these bottom-90% households are hit by a downturn and are forced to sell 50 percent of their already small equity portfolios, the forced-selling footprint equals roughly 3 percent of each region’s total holdings. For US households, that translates into about $2.0 trillion in equity liquidations. Europe would add another $240 billion, and Japan another $30 billion, all directed into US equity markets because that is where the foreign exposure is concentrated.
The result is a combined $2.3 trillion of forced selling into the US market, coming not from institutions or sovereign investors that are likely to take profits early as conditions weaken, but from the segment of global households most exposed to layoffs, income shocks and rising financing costs.
These investors typically react later, often only after the slowdown becomes visible in their own cash flow. This creates a situation where professional sellers move first, while retail and household-level capital follows under pressure, adding a delayed but strong wave of supply into an already fragile market structure.
Third round of the Carry Trade
We thought the carry trade story peaked in August 2024 and again in April 2025, but it looks like we are gearing up for another round as we approach the end of 2025 or even 2026. Rate cuts in the EU or the US combined with tightening in Japan would pour gasoline on the problem through an unwind of the global carry trade.
Cuts may look bullish for valuations at first glance, yet they could easily trigger another forced liquidation wave. This time possibly with bigger spillovers in the EU stock market.
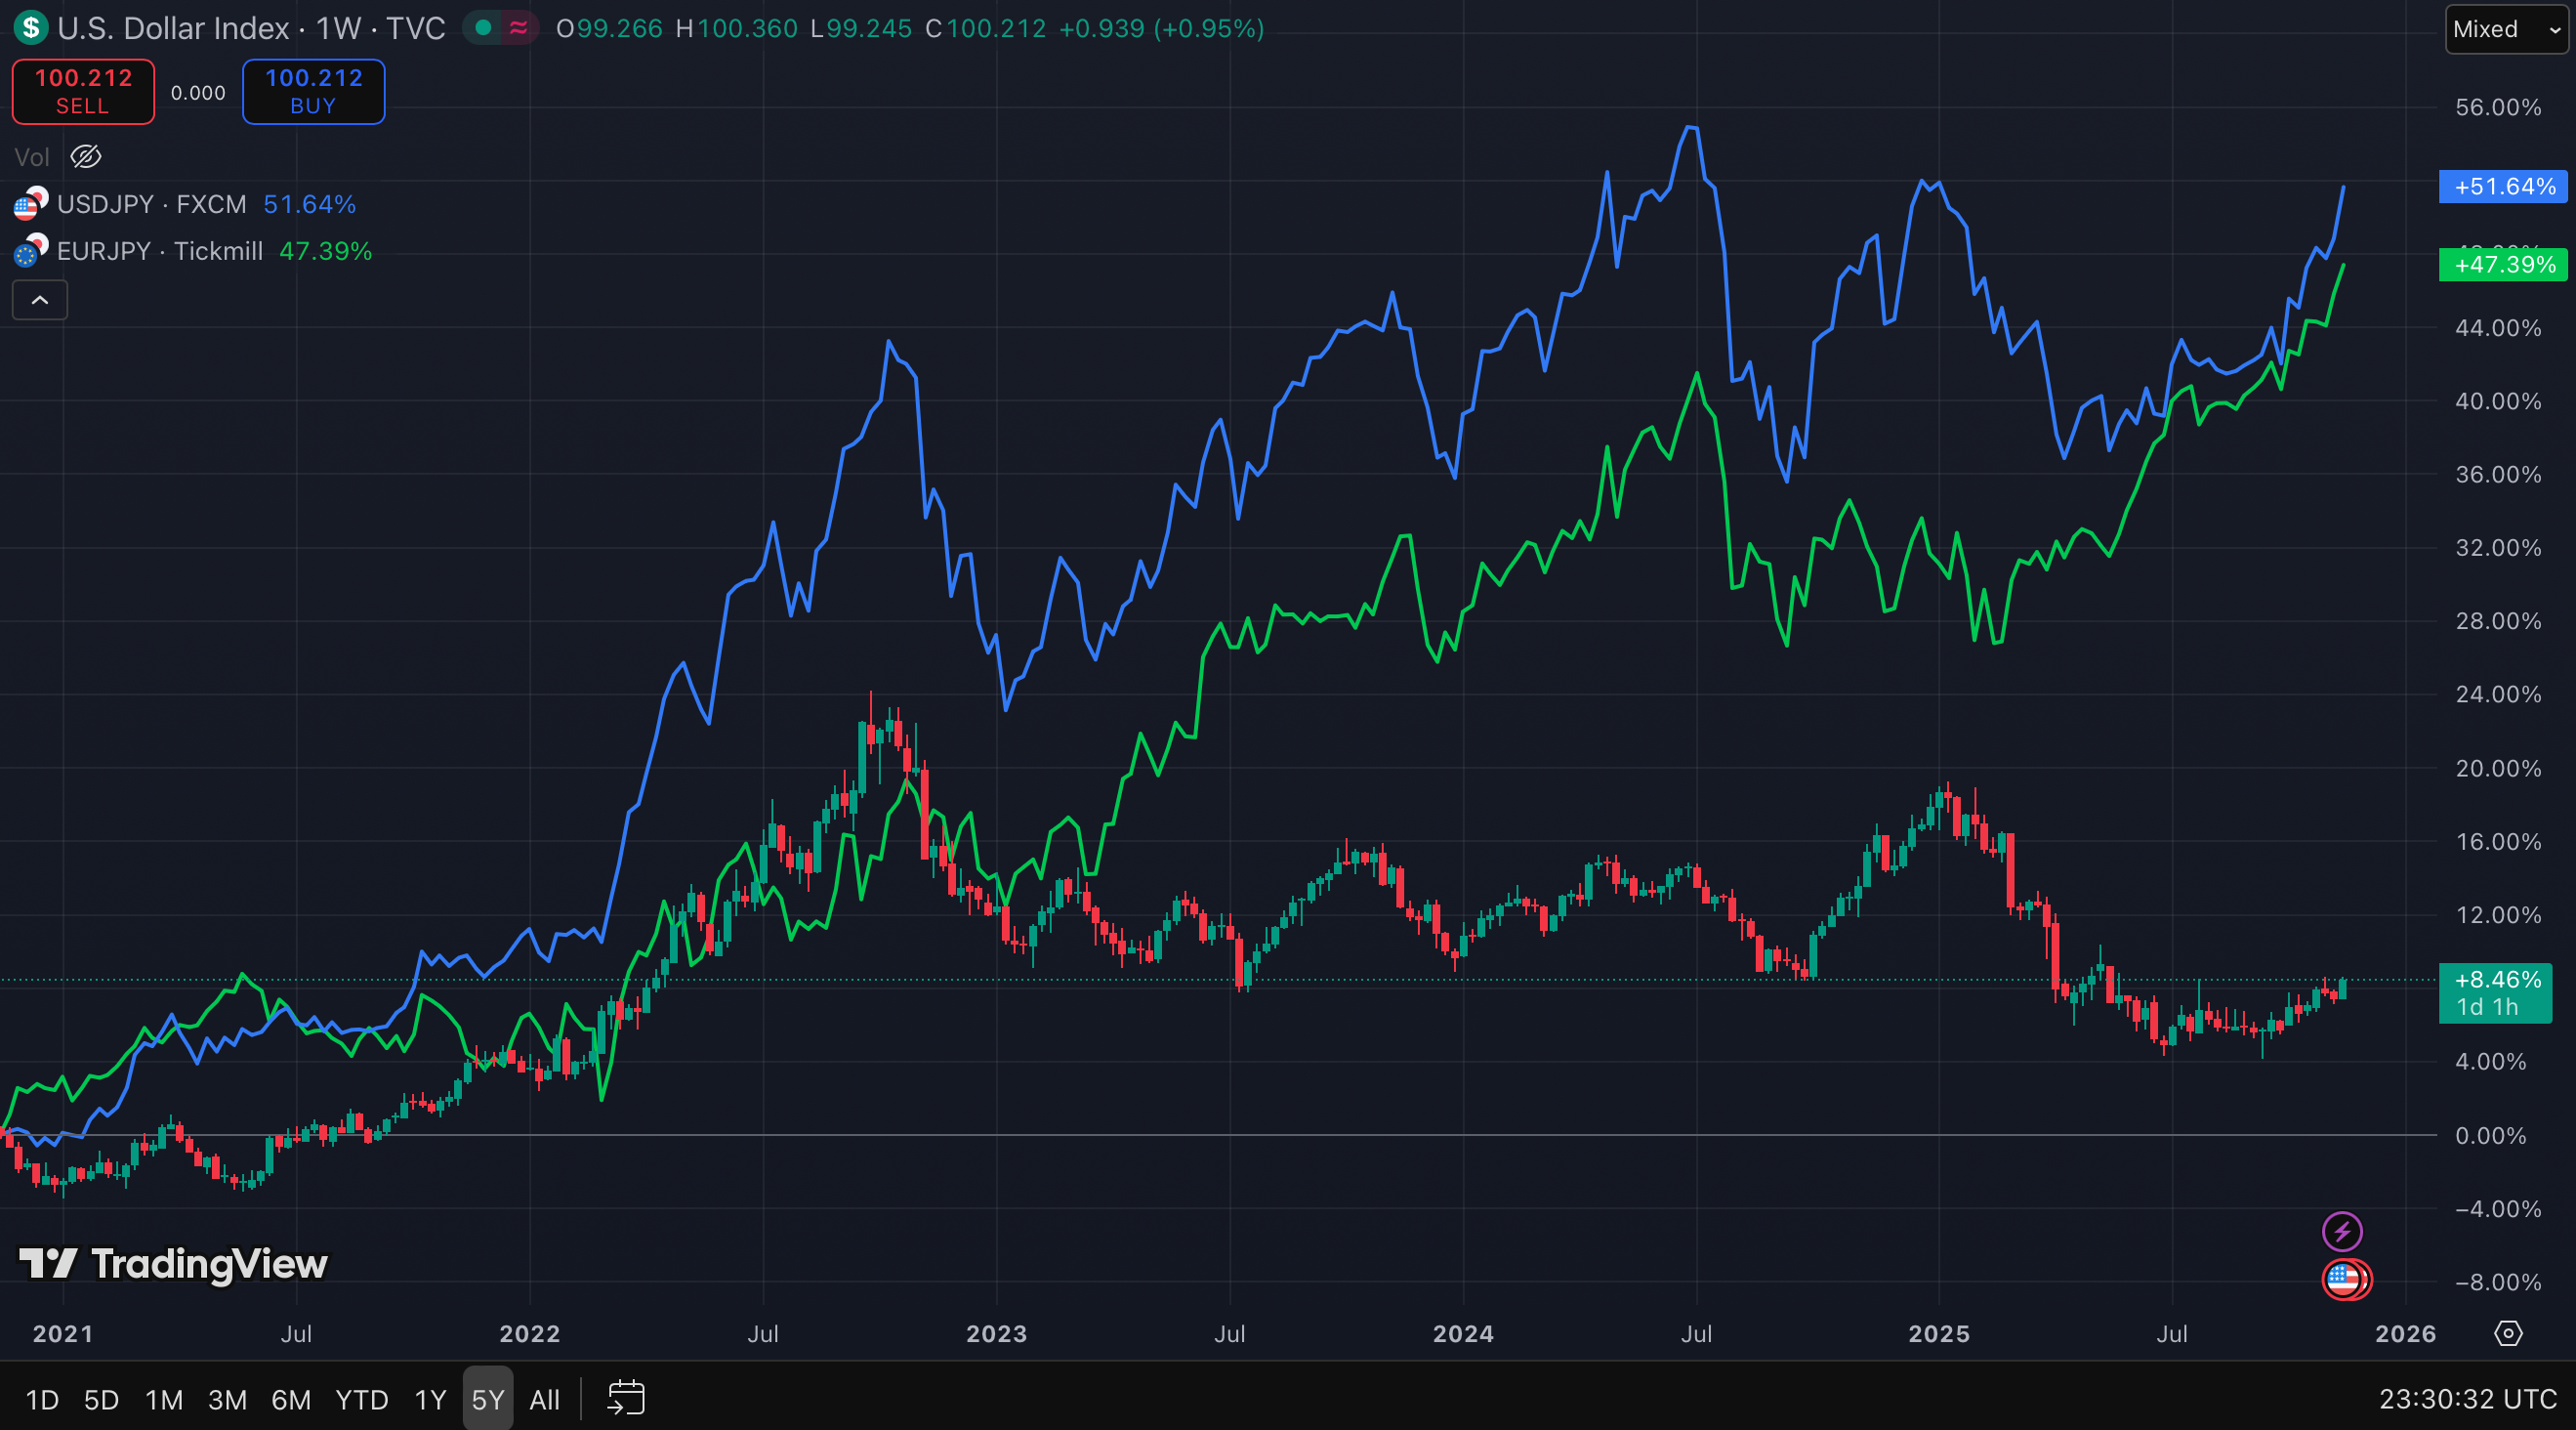
Even though the euro has taken some pressure off the DXY and given US companies a bit of relief this year, the yen is telling a different story. The price action suggests we are already in the third round of the yen-funded global carry trade.
The yen is now at its weakest level ever against the euro, and USDJPY is approaching its five-year lows, back near the levels we saw right before the April and August sell-offs.
The AI Narrative.. First GPUs.. now Energy… Now DRAM?
The AI narrative seemed to hit another wall.. besides rising energy prices and the impact of families energy bills.
DRAM and especially HBM prices are in a full-on bull market. Contract DRAM prices are up about 170% year-on-year as of Q3 2025, with some quarters seeing 50% jumps on their own and analysts expect shortages to persist into 2026. Nvidia H100/H200 and upcoming Blackwell parts are heavily dependent on HBM3/HBM3E and high-density DRAM, and reports already show memory vendors effectively sold out a year ahead on AI orders. In that world, any hiccup in memory supply or further price spike can bottleneck GPUs even if Nvidia’s own silicon is ready while pressuring margins.
For hyperscalers and large enterprises, that translates directly into deployment risk. If you budgeted an AI rack at last year’s DRAM prices and those prices are now 50–100% higher with only ~70% of your orders getting filled, your capex per unit of compute jumps and your rollout schedule stretches.
Higher system costs are arriving just as interest rates remain elevated, so both financing costs and depreciation per GPU continue to climb. Each rack requires more capital and the asset starts from a higher cost base. What makes this even more challenging is that a new GPU cycle and the eventual normalization of memory prices can actually accelerate depreciation, forcing hyperscalers and some of the other MegaCaps to write down expensive hardware even faster.
While… they are actually extending useful life of the servers??? Hey Michael!
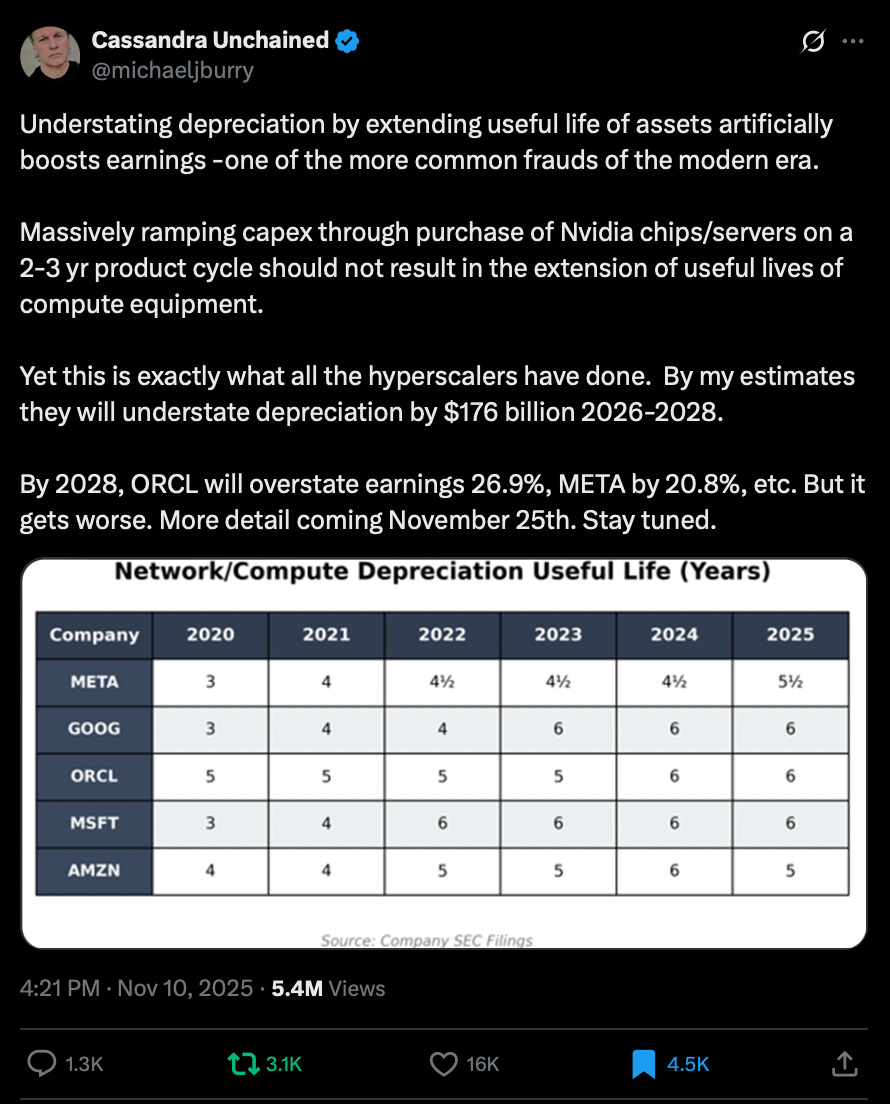
That combination makes each delayed month of deployment more painful on the P&L and can push CFOs to slow or phase rollouts rather than taking delivery at any price.
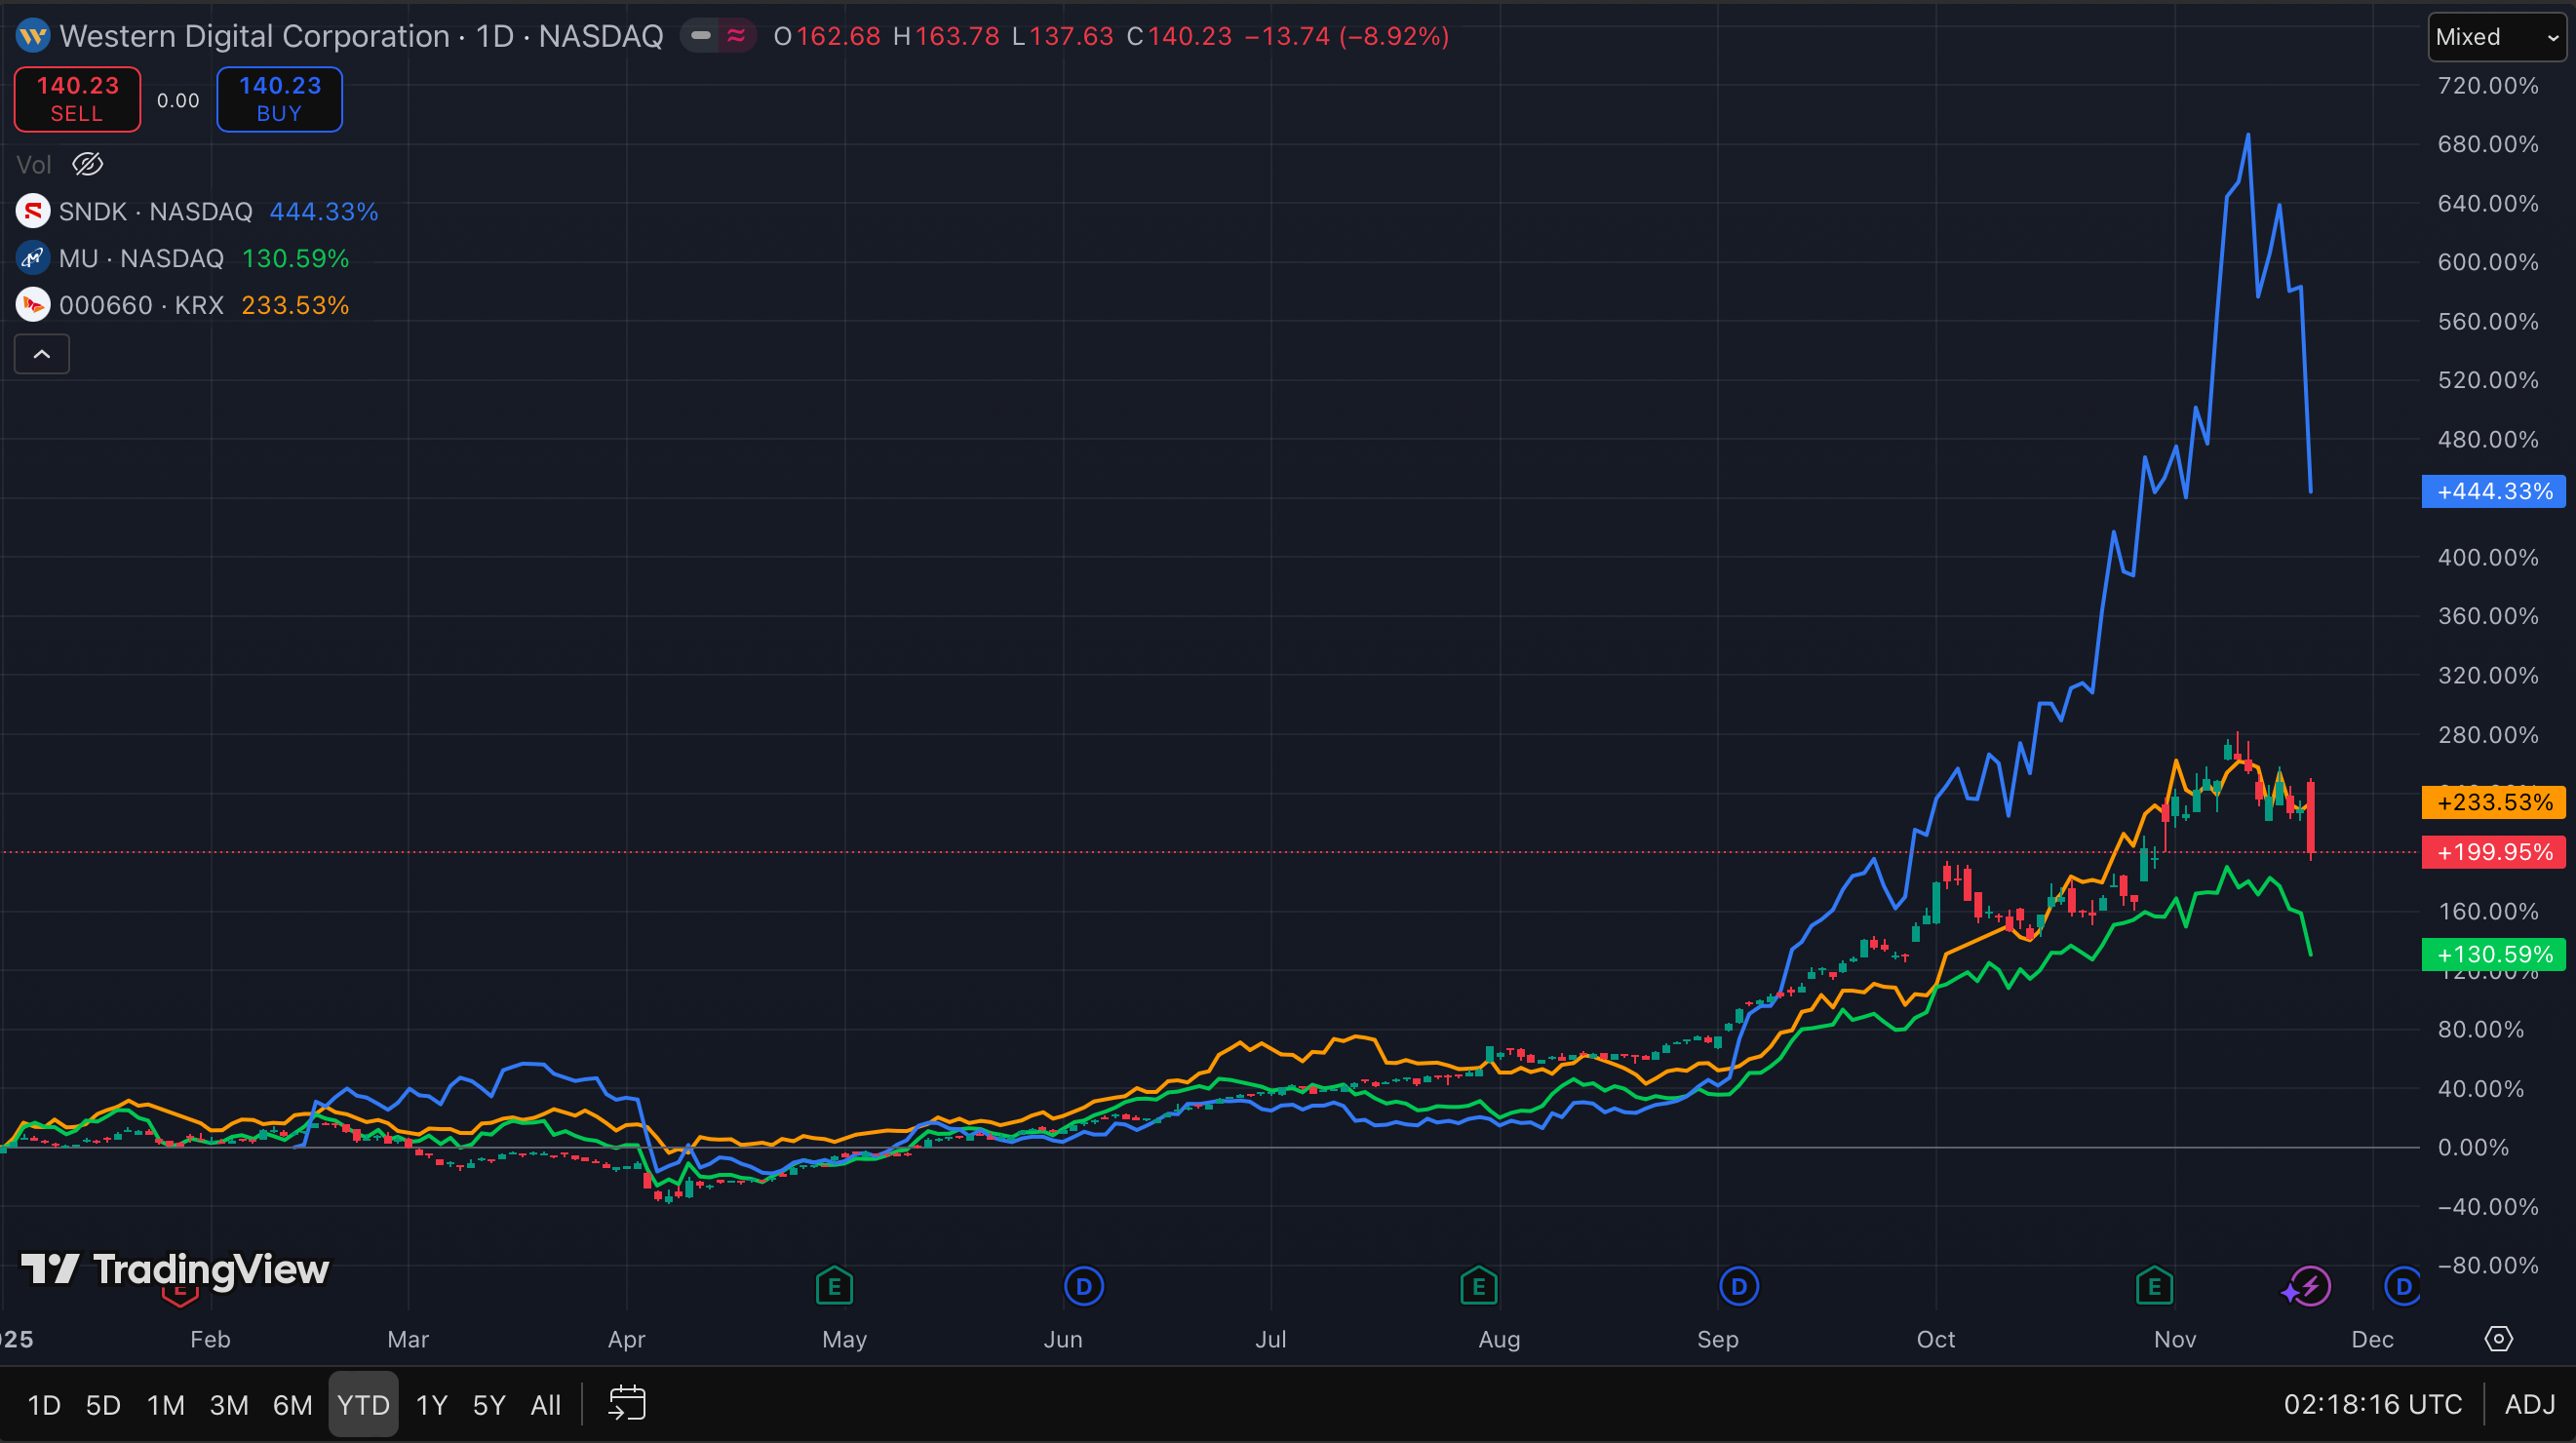
Historically, DRAM was the classic low-margin, boom-bust commodity: vendors overbuilt capacity, inventories piled up, prices crashed, and returns hovered at unattractive levels. Recently operating margins expanding for Samsung, SK hynix and Micron as inventories cleared and premium products like DDR5 and HBM took over the mix.
At the same time, capacity is being diverted into advanced HBM and next-gen nodes, tightening supply for “plain” DRAM and even pushing up NAND/SSD prices. So a segment that used to be treated as a cheap, replaceable commodity has suddenly become a high-margin choke point.
If this tightness persists, memory pricing rather than GPU pricing could be what ultimately forces Nvidia and its customers to re-think deployment schedules, rack designs, and the pace of AI capex.
And yet.. these are the top holdings in the SP500
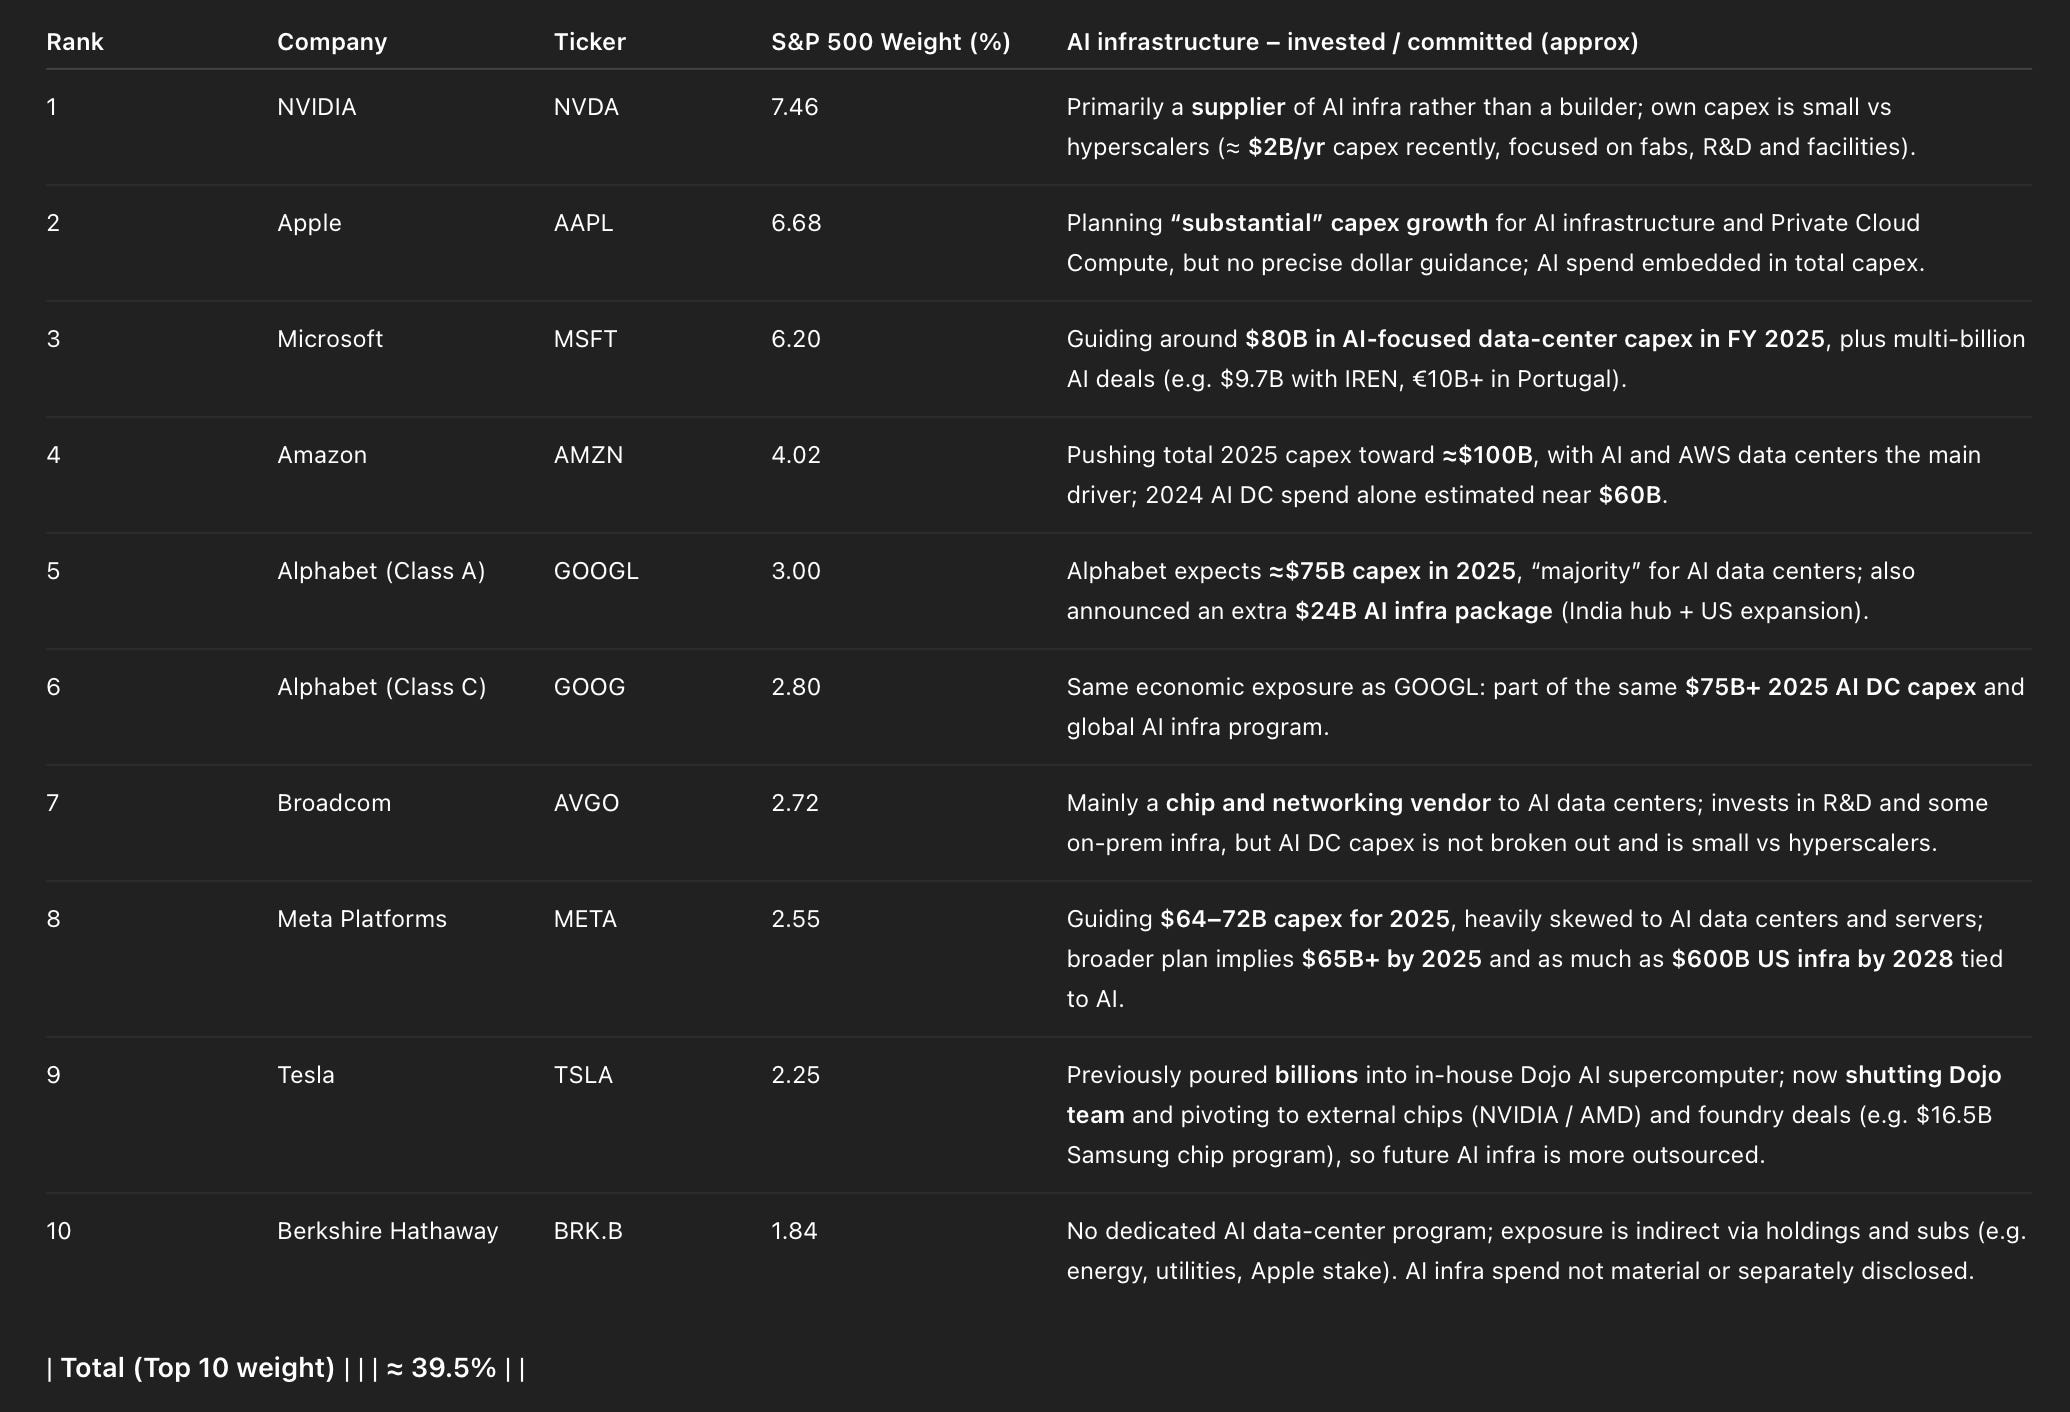
Most of the SP500 is now exposed to AI infrastructure dynamics. The top 10 positions represent more than 39% of the Index.
The FED wont save us… but will give Trump an Excuse
It’s Powell’s fault! Sure, let’s go with that. I won’t even get into that debate, but if Trump wants to pin it on Powell and the former Treasury Secretary for not issuing more long-dated bonds, fine. The irony is that the risk would simply show up somewhere else in the economy anyway.
Monetary policy will not be able to respond quickly without triggering meaningful inflation risks, especially while the war in Ukraine remains unresolved. I believe resolving the conflict has become the top priority if we want the Fed to regain room to maneuver. Until then, the policy lags may force governments toward fiscal expansion and could open the door to further USD depreciation specifically vs the EURO.
This time is different … or?
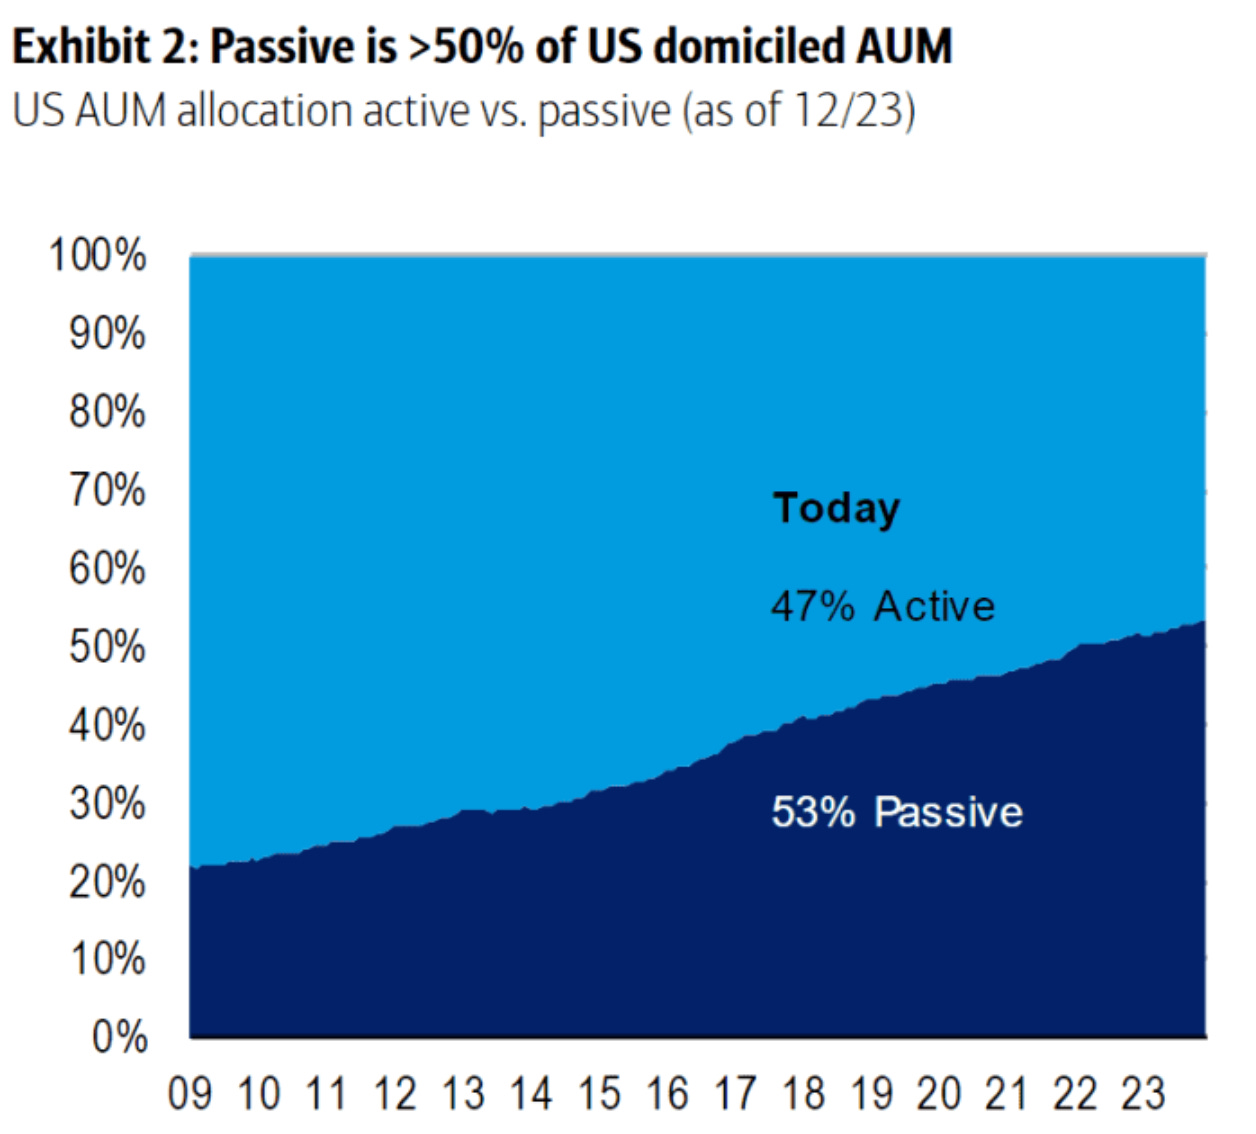
Buffett cutting beta, Burry buying puts, Ryan Cohen calling out structural fragility, Nicolai Tangen urging caution from the sovereign wealth side, Mike Green warning about passive flows — and many others adding to the chorus.
Pick your side

👍