Bitcoin Wave Incoming?
My view on Bitcoin in the current enviornment

Hello everyone,
Today, we’ll explore Bitcoin and why I believe we may be at a point where its relative attractiveness is increasing.
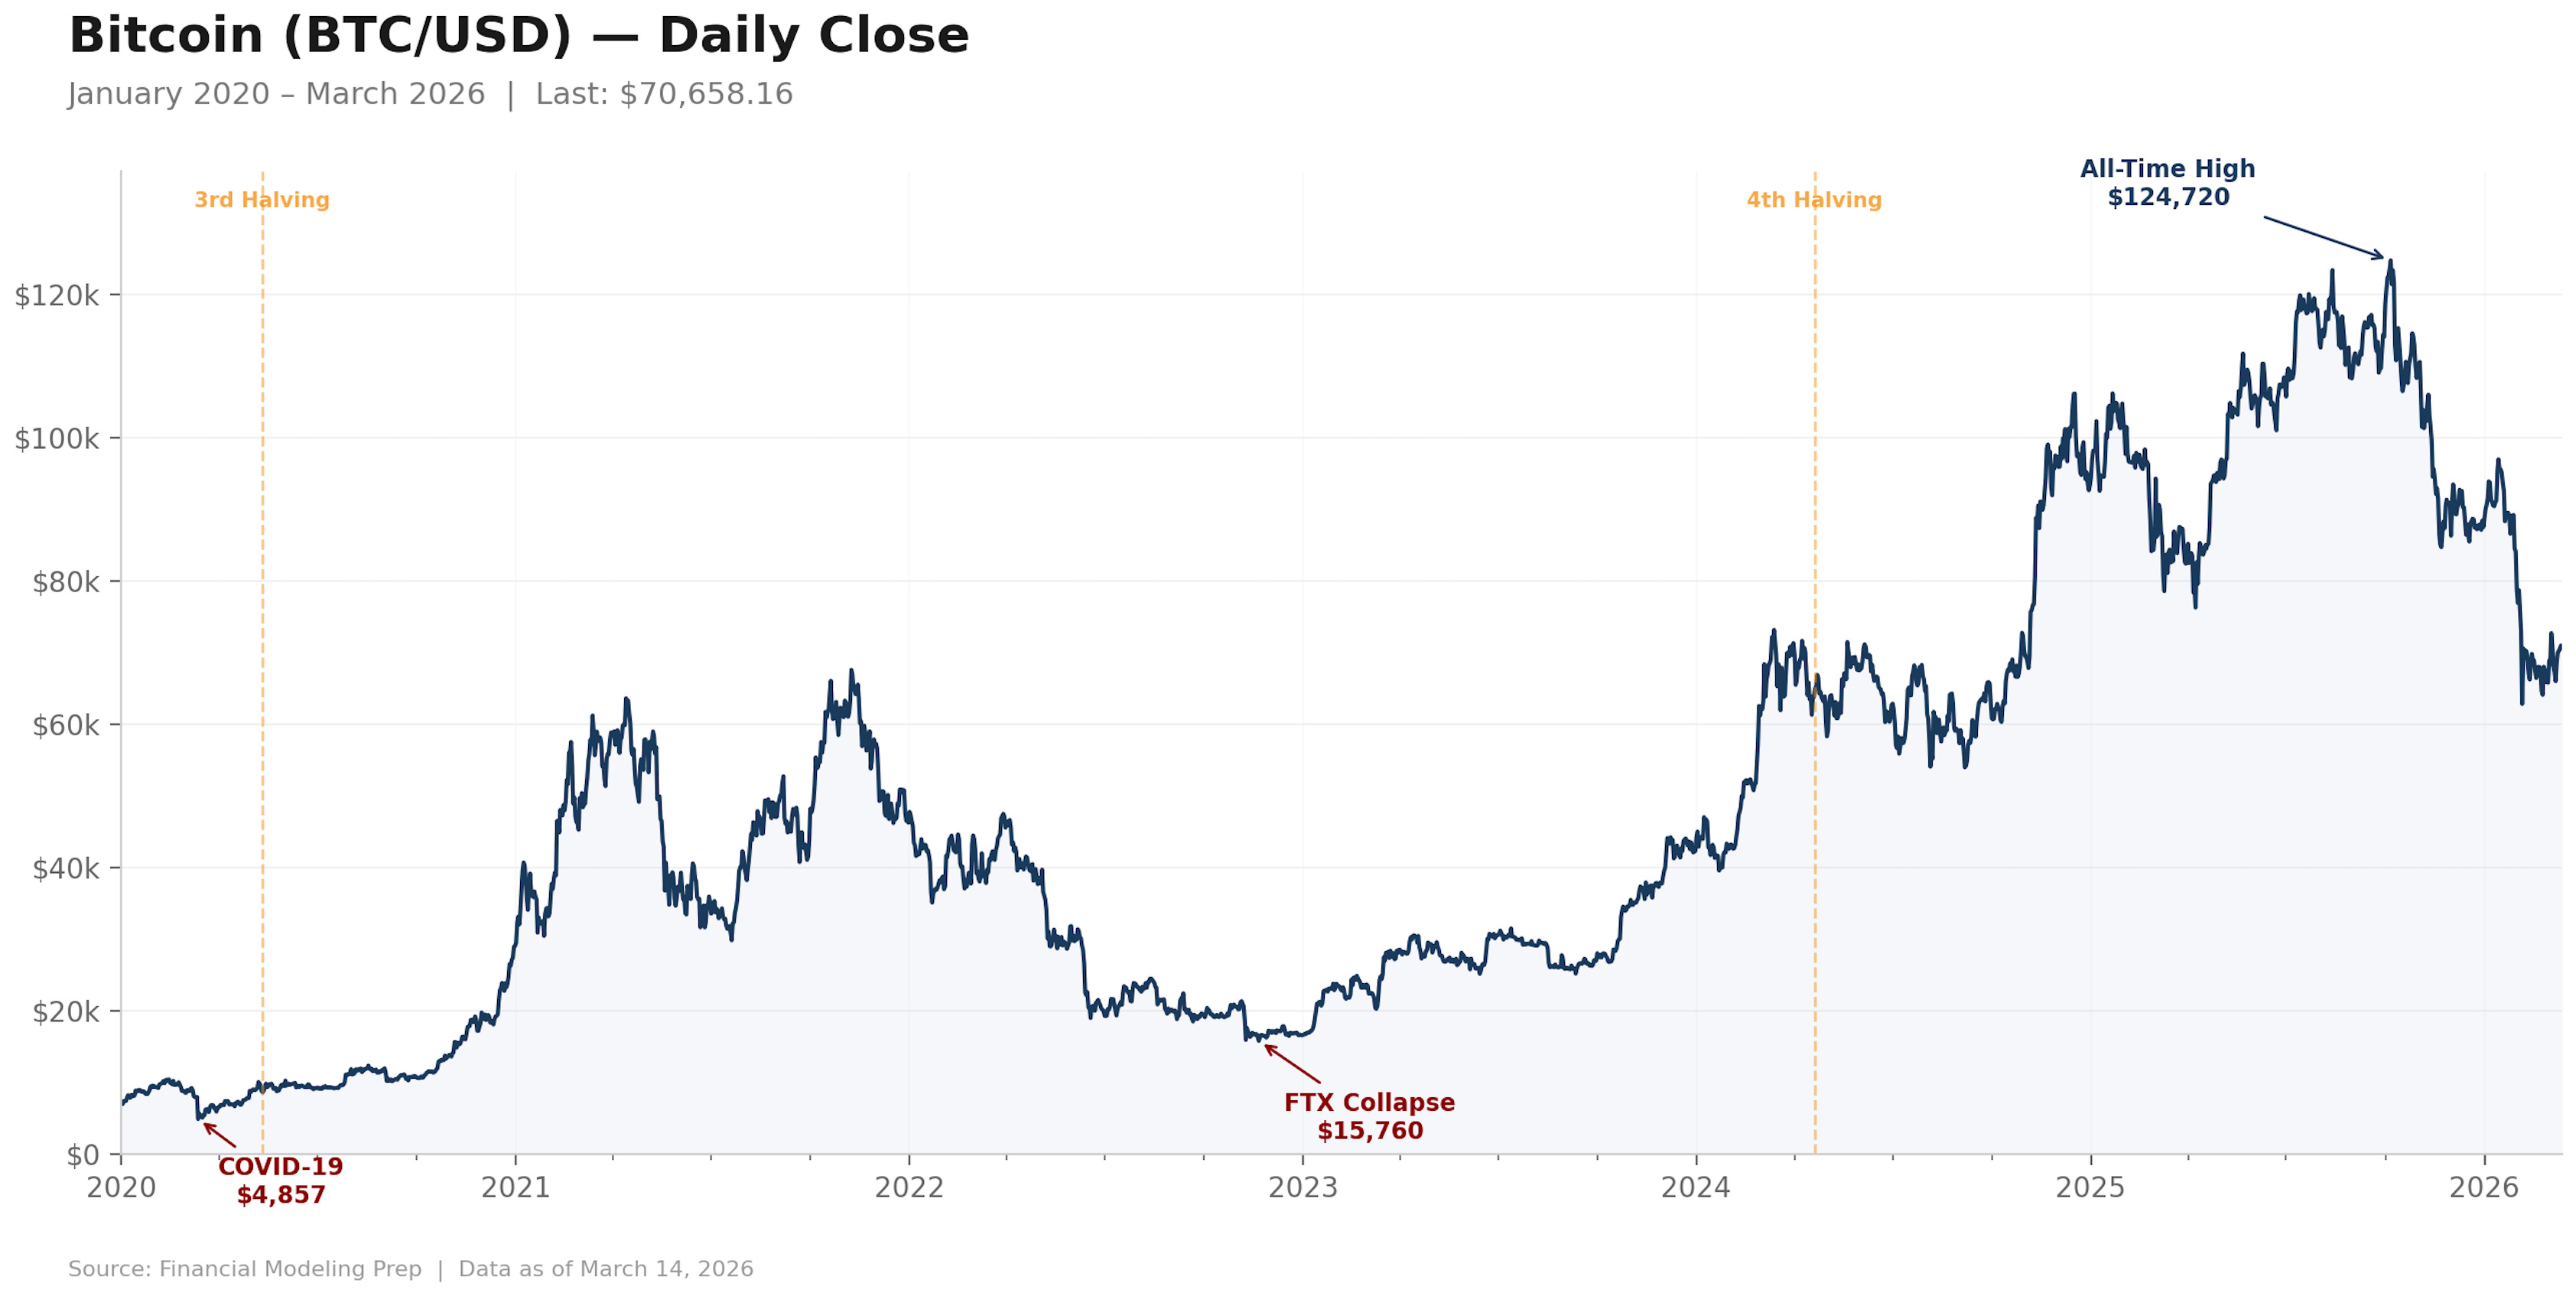
To do that, we need to understand the 2022 Bitcoin selloff, the recovery in both equities and Bitcoin from 2023 to 2025, and the reasons the new selloff began in 2025. By looking at where we are today and the key dynamics that have driven Bitcoin throughout this period, we can better understand why it is down more than 50% from its all-time high.
The move from 2020 to 2022 was largely consistent with broader equity market performance: ultra-low interest rates and the currency debasement narrative had gone mainstream.
By the end of 2021, expectations of higher interest rates were building and the war in Ukraine began in early 2022. The selloff in broad equities was severe, and Bitcoin fell alongside them. However, Bitcoin had accumulated significant leverage over the previous two years, which made the decline even more pronounced as that leverage began to unwind.
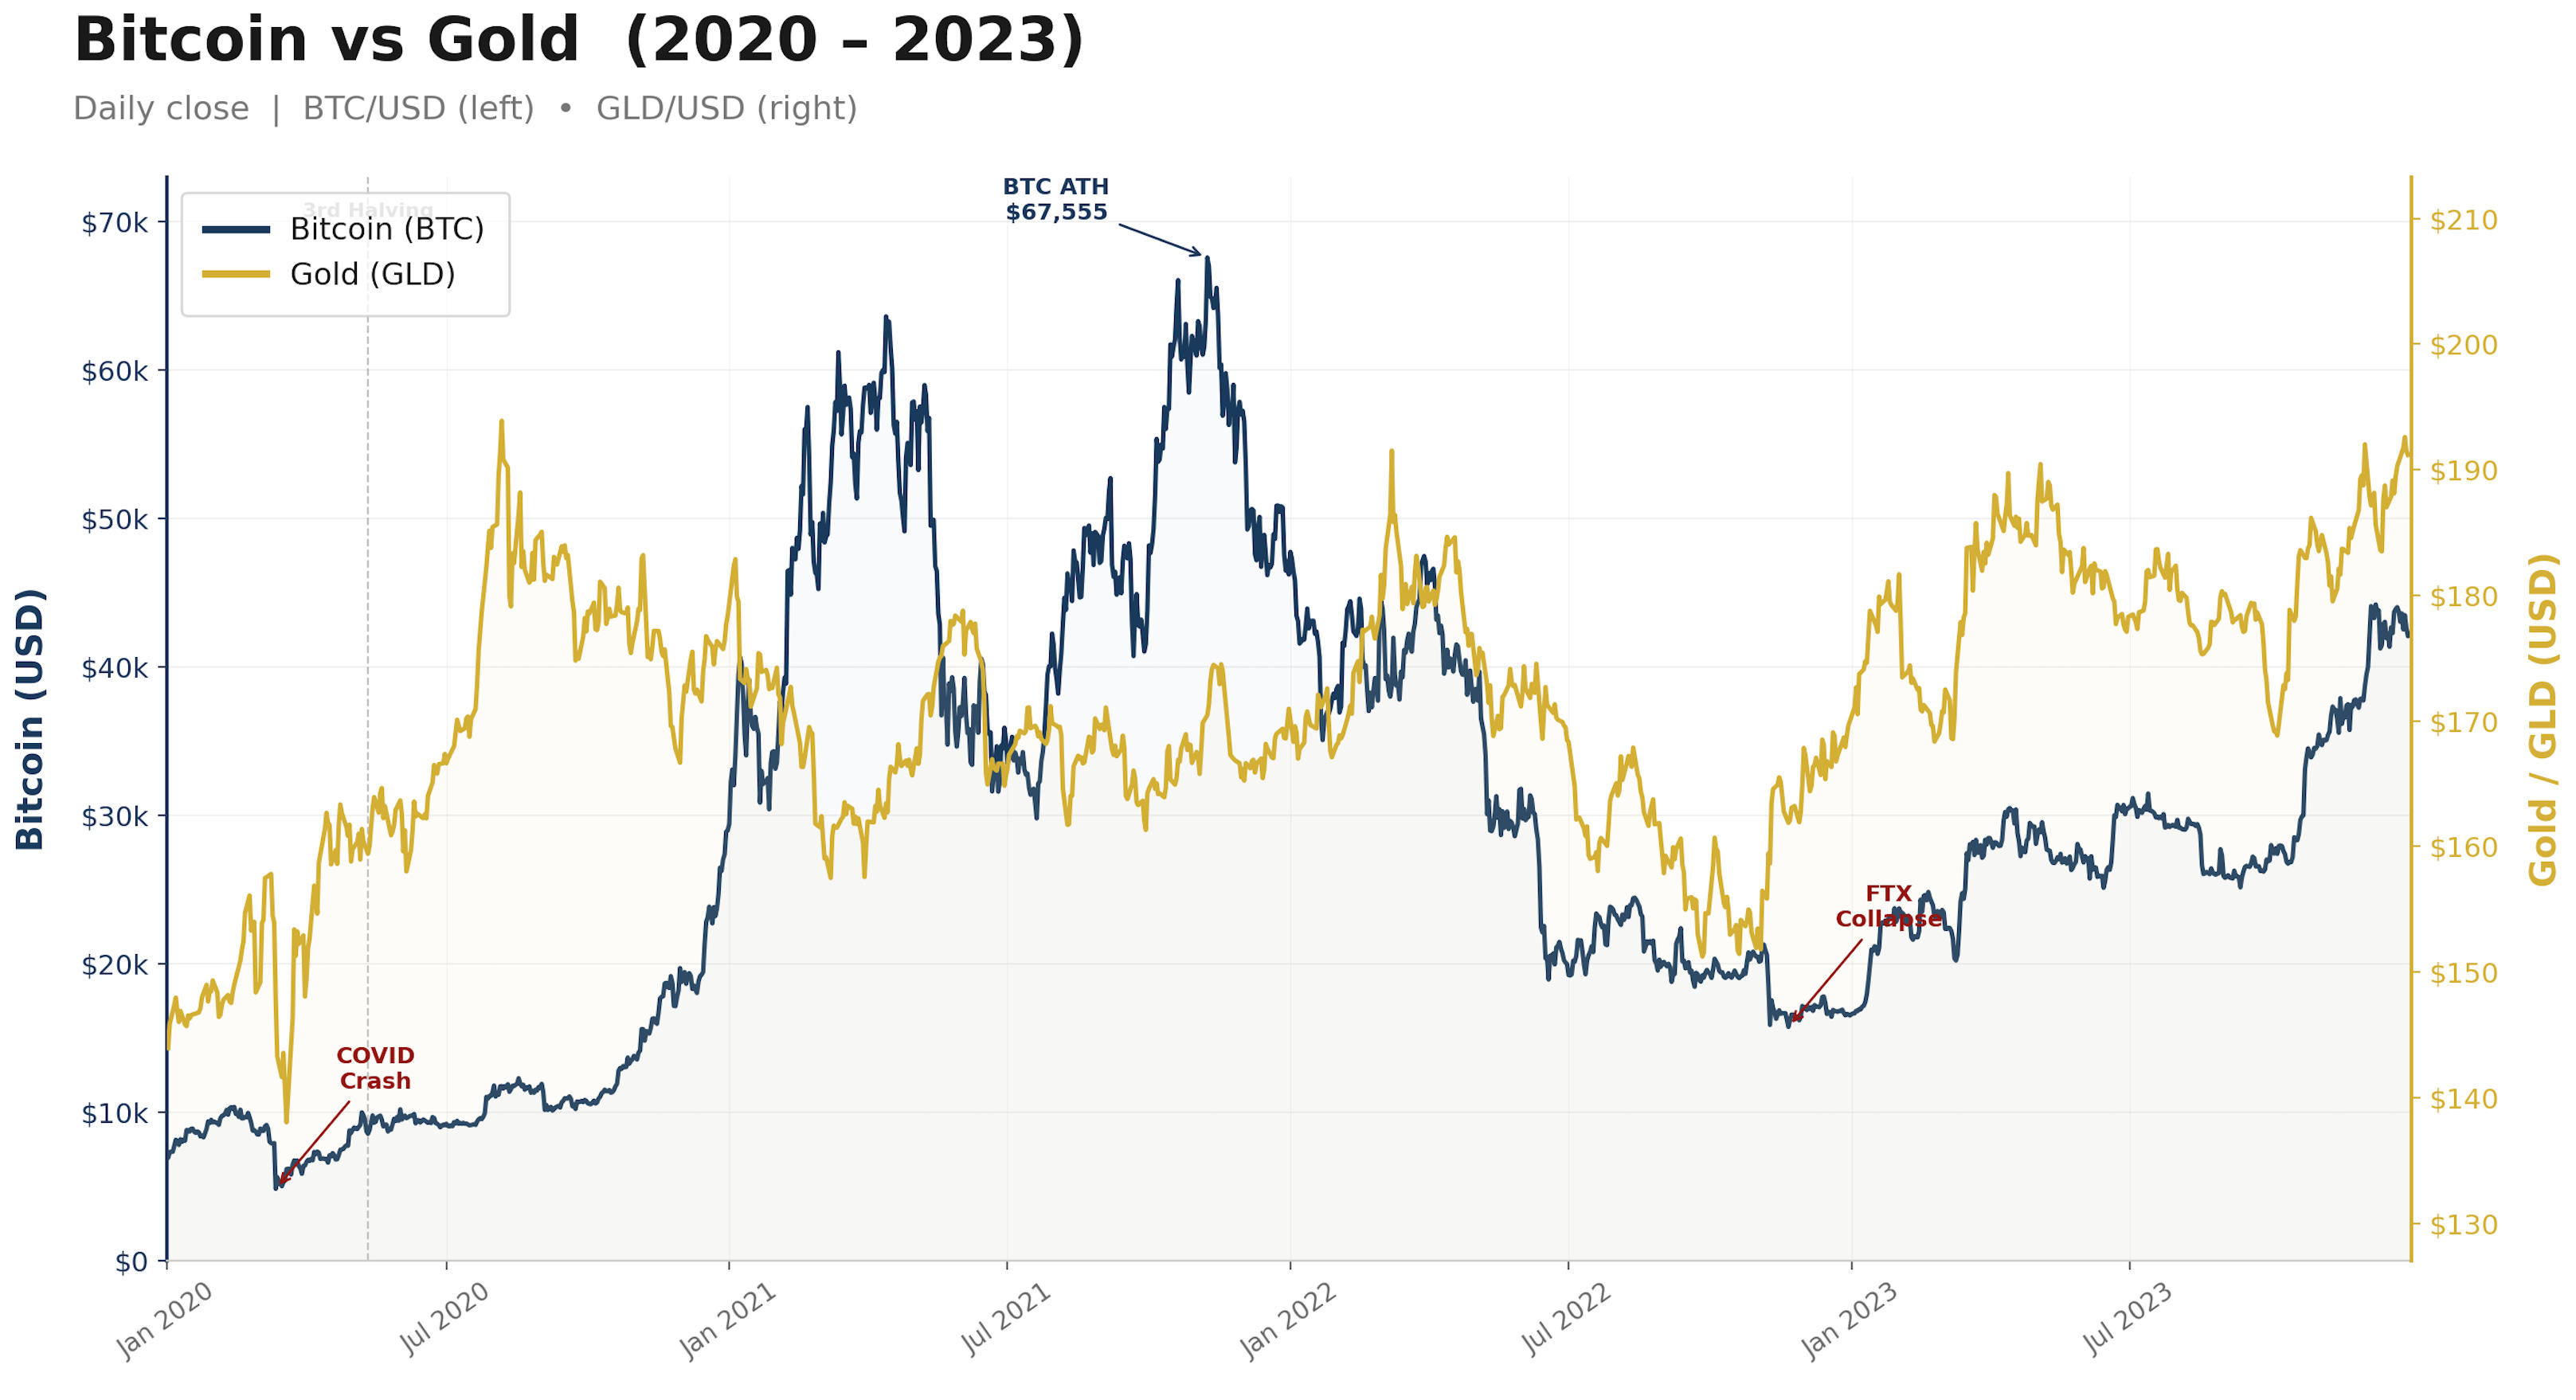
The argument that Bitcoin was not an effective hedge against inflation gained traction, especially as gold proved more resilient than BTC. However, that view overlooks the sheer amount of leverage that had to be flushed out of the crypto market after the excesses of the zero-rate era, when investors had become conditioned to believe rates would remain near zero indefinitely. As the Fed itself suggested at the time, it was “not even thinking about thinking about raising rates.”
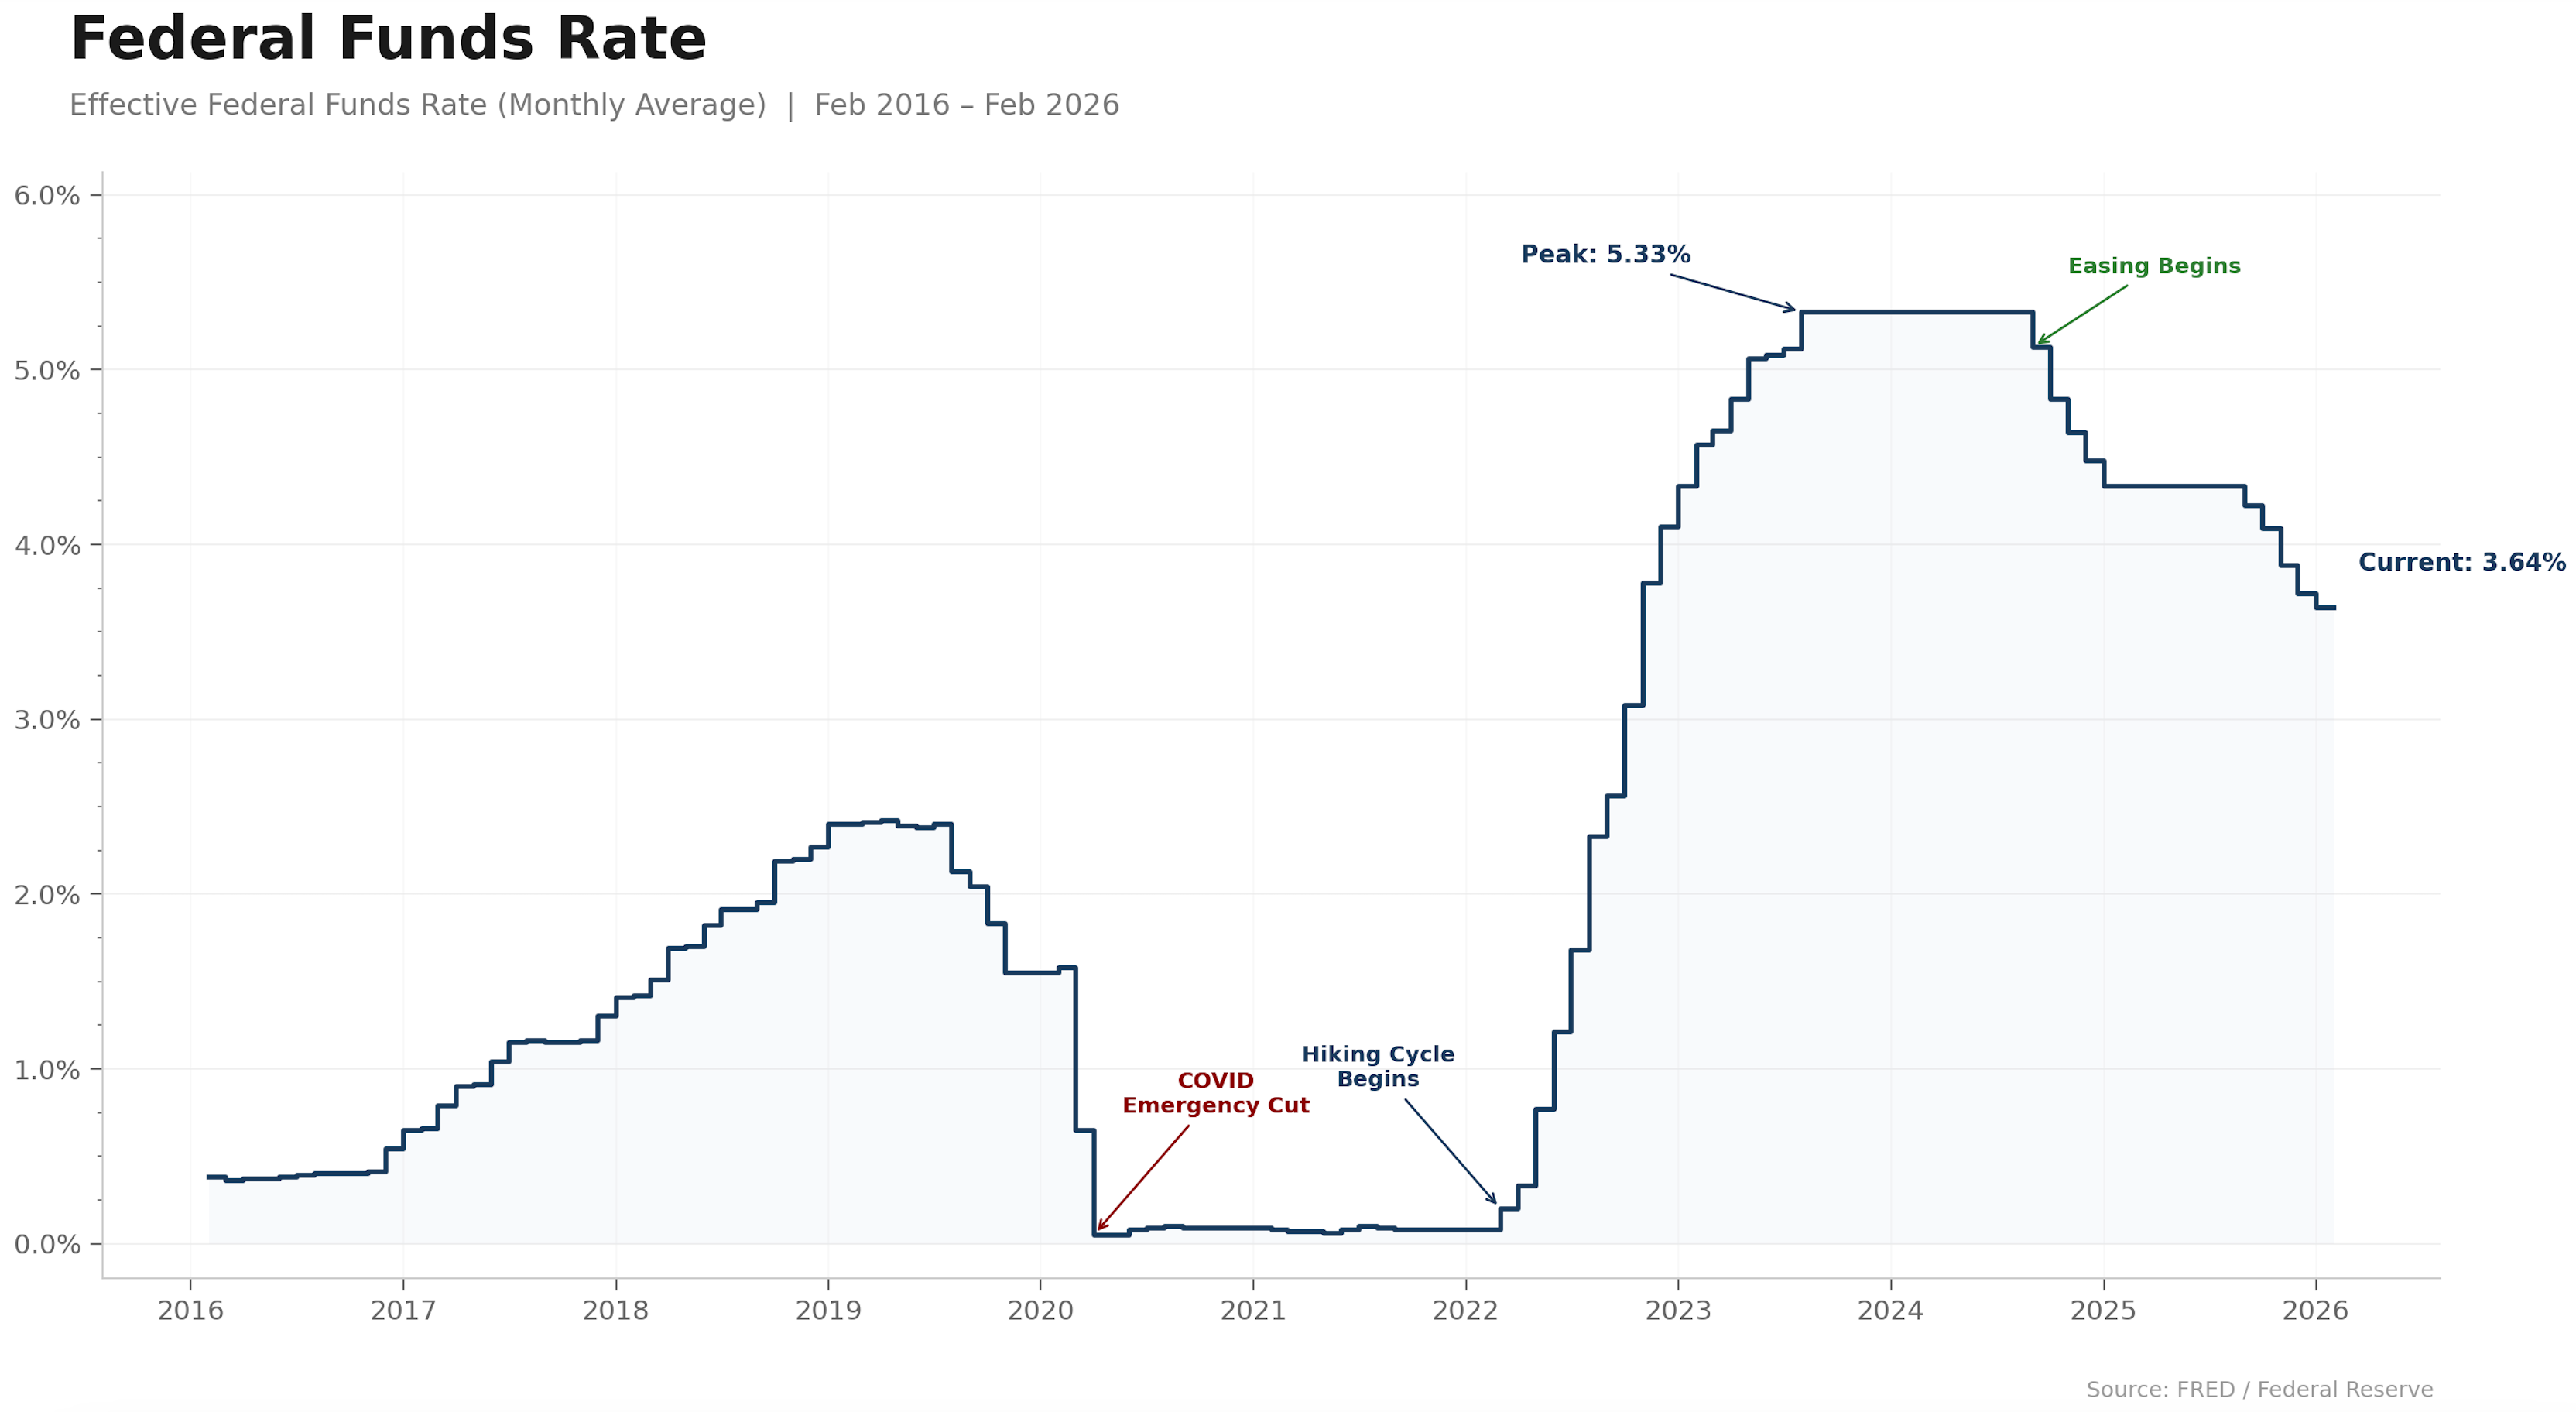
The rapid rise in interest rates was crucial to stabilising markets and pushing US equities higher through global capital flows far from the FED policy mistake most people claim. A stronger dollar and higher rates began to put pressure on emerging markets, while the US economy was partly shielded from the immediate impact. In the short term, many US companies were protected because their borrowing costs had already been fixed for a given period.
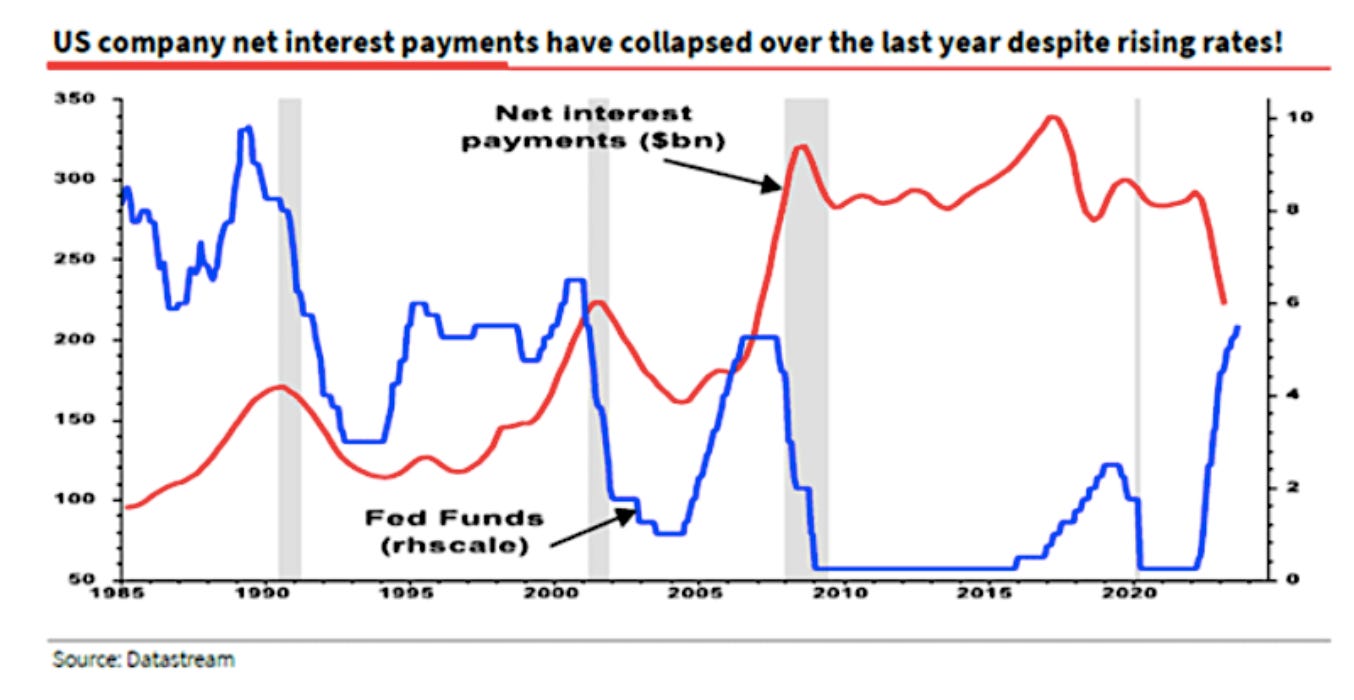
In fact, for some US companies, net interest payments actually declined during this time, as excess cash was invested in debt securities yielding far more than the cost of paying down existing debt. So while much of the rest of the world was being strained by the stronger dollar regime, the domestic US economy remained relatively insulated.
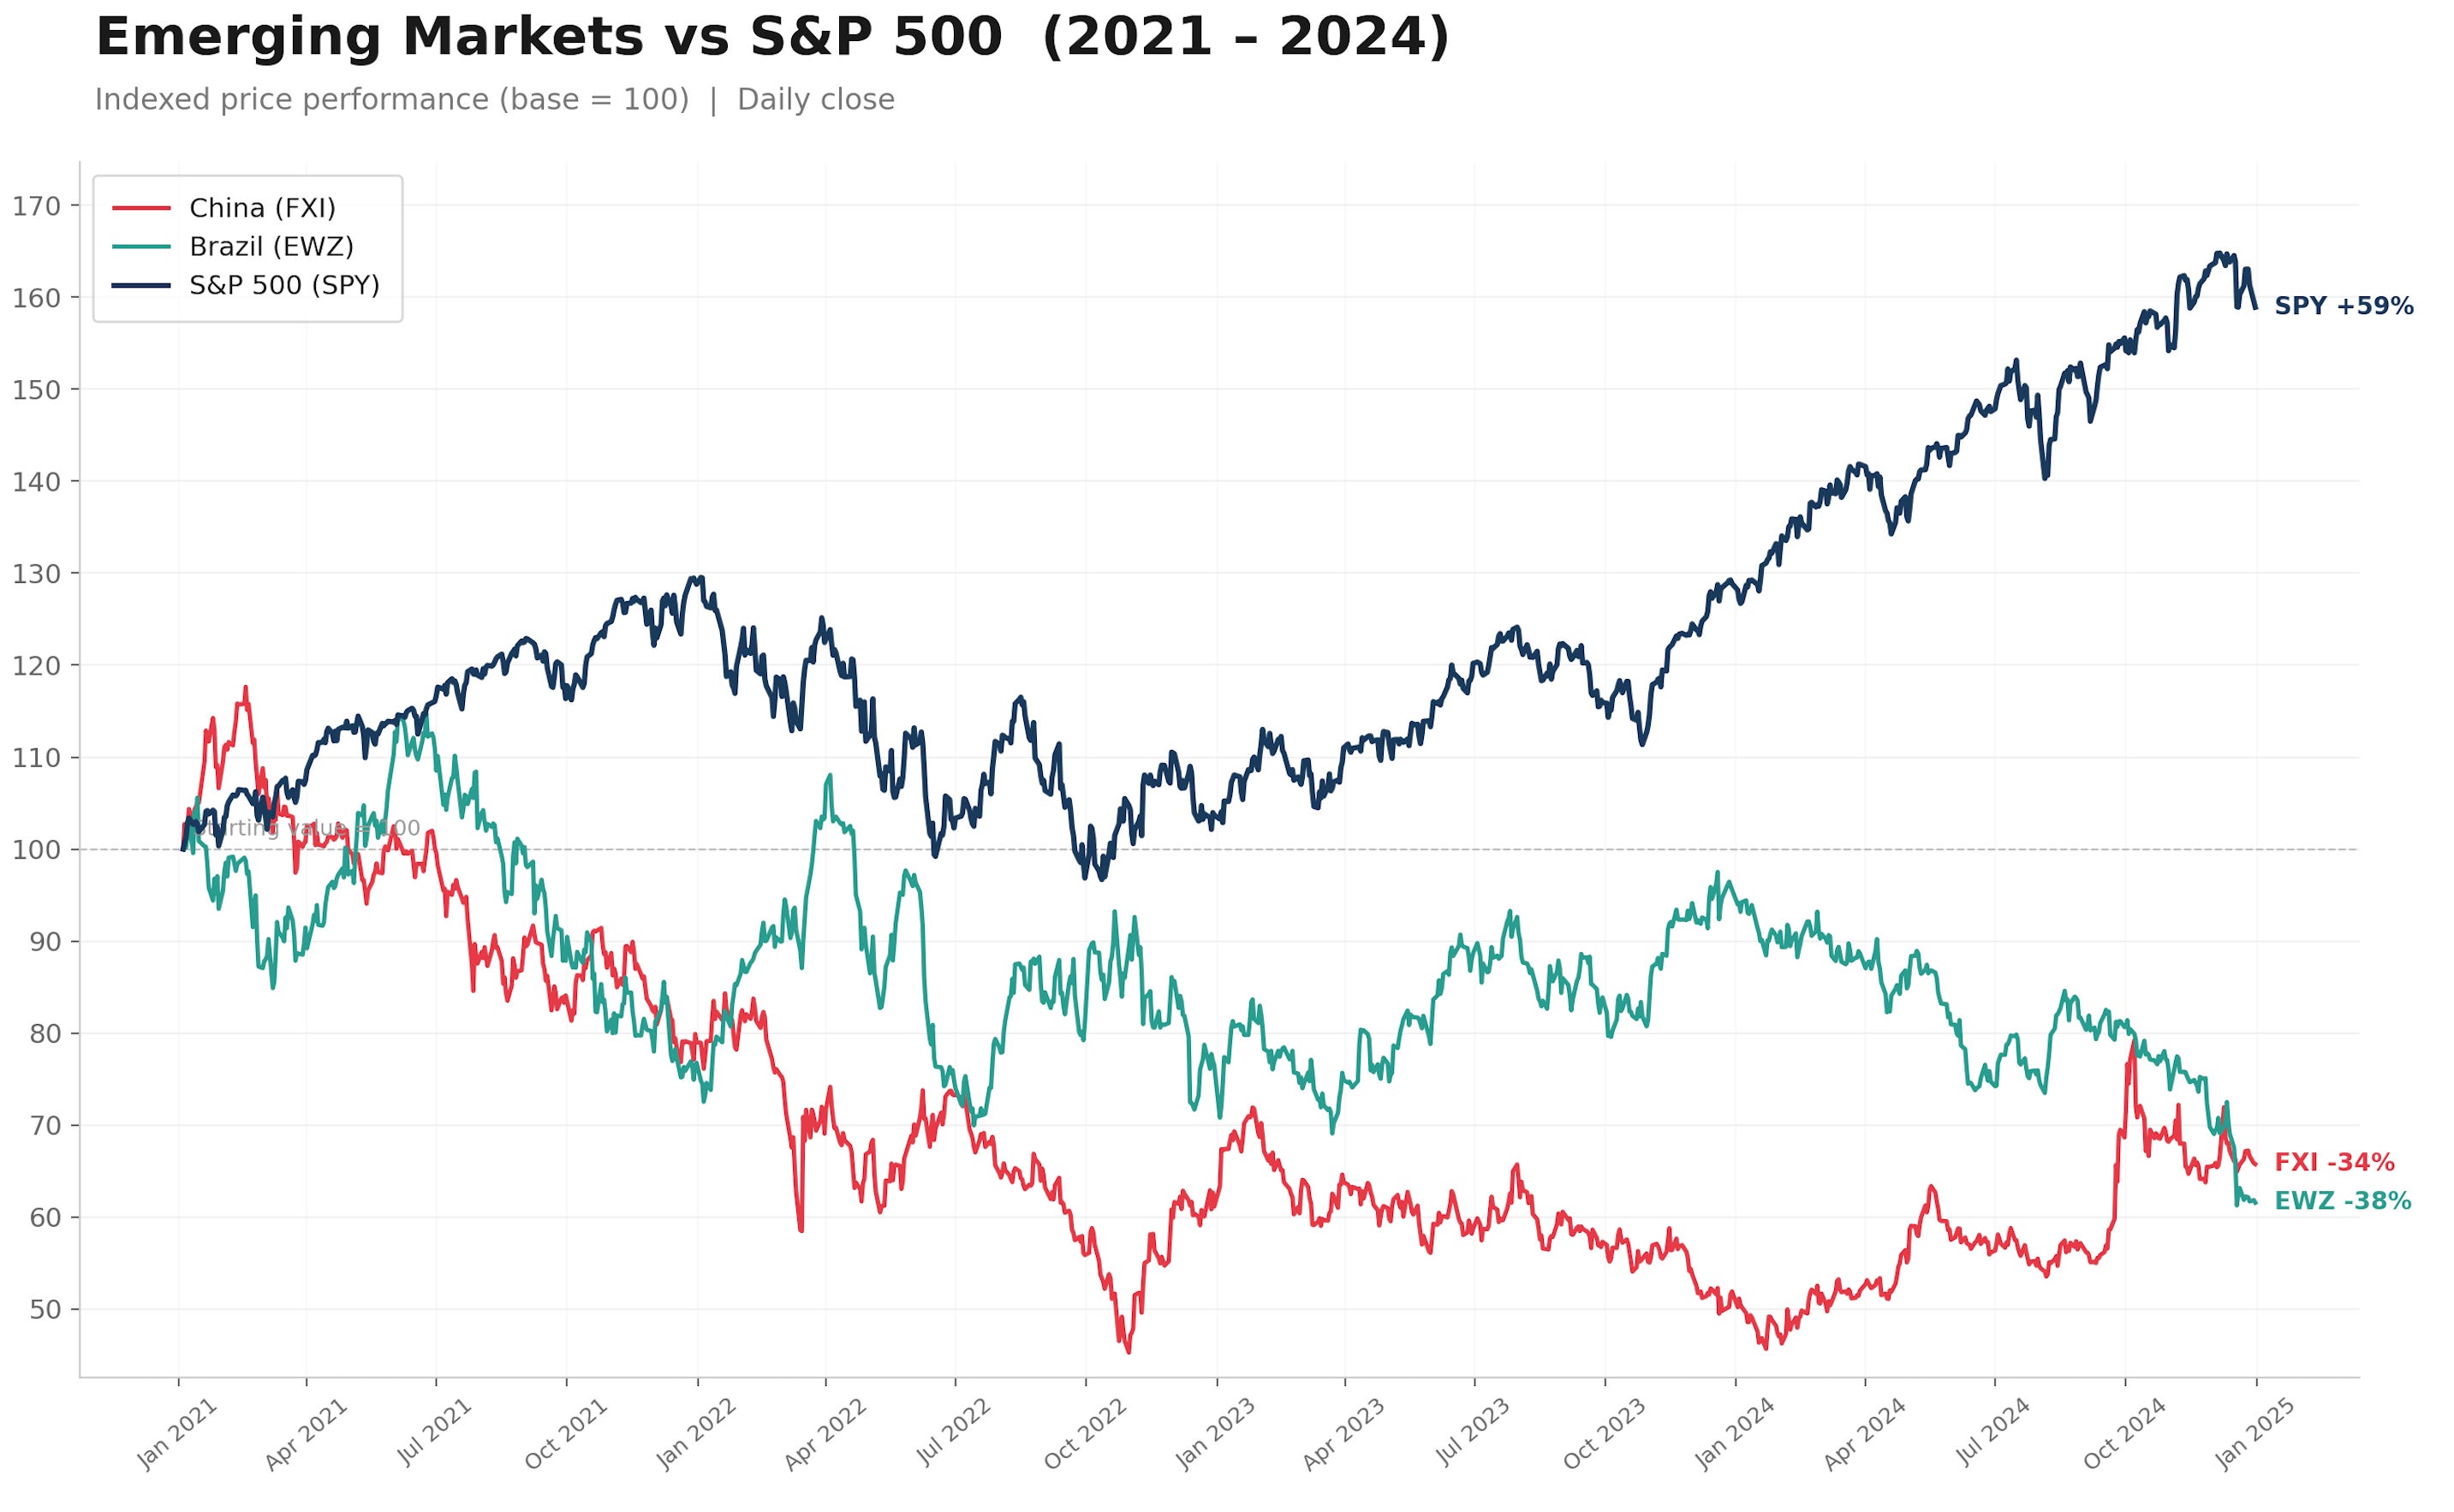
Fast forward to 2023: even with interest rates still elevated, equity markets began to rally, and Bitcoin eventually moved higher alongside the broader advance in US and European equities, as well as gold. The key question is what actually allowed valuations to expand so much over the past three years. While many people attribute most of the move to the AI narrative, the reality is, in my opinion, that the explanation is far more technical.
As we can see, a strong-dollar policy disproportionately harmed emerging economies, driving both capital outflows and emigration from those markets while channeling investment into US equities, much like the dynamics of the yen carry trade. This policy stance, combined with the resilience of the US economy, fuelled global capital flows at a time when leverage was rising through both direct lending and derivatives, the AI narrative was gaining momentum and demand for passive investment vehicles was reaching record highs.
Although the low-rate environment of 2020–2021 led to extreme leverage across the US financial system, it is striking that those levels have now been completely surpassed by today’s margin balances.
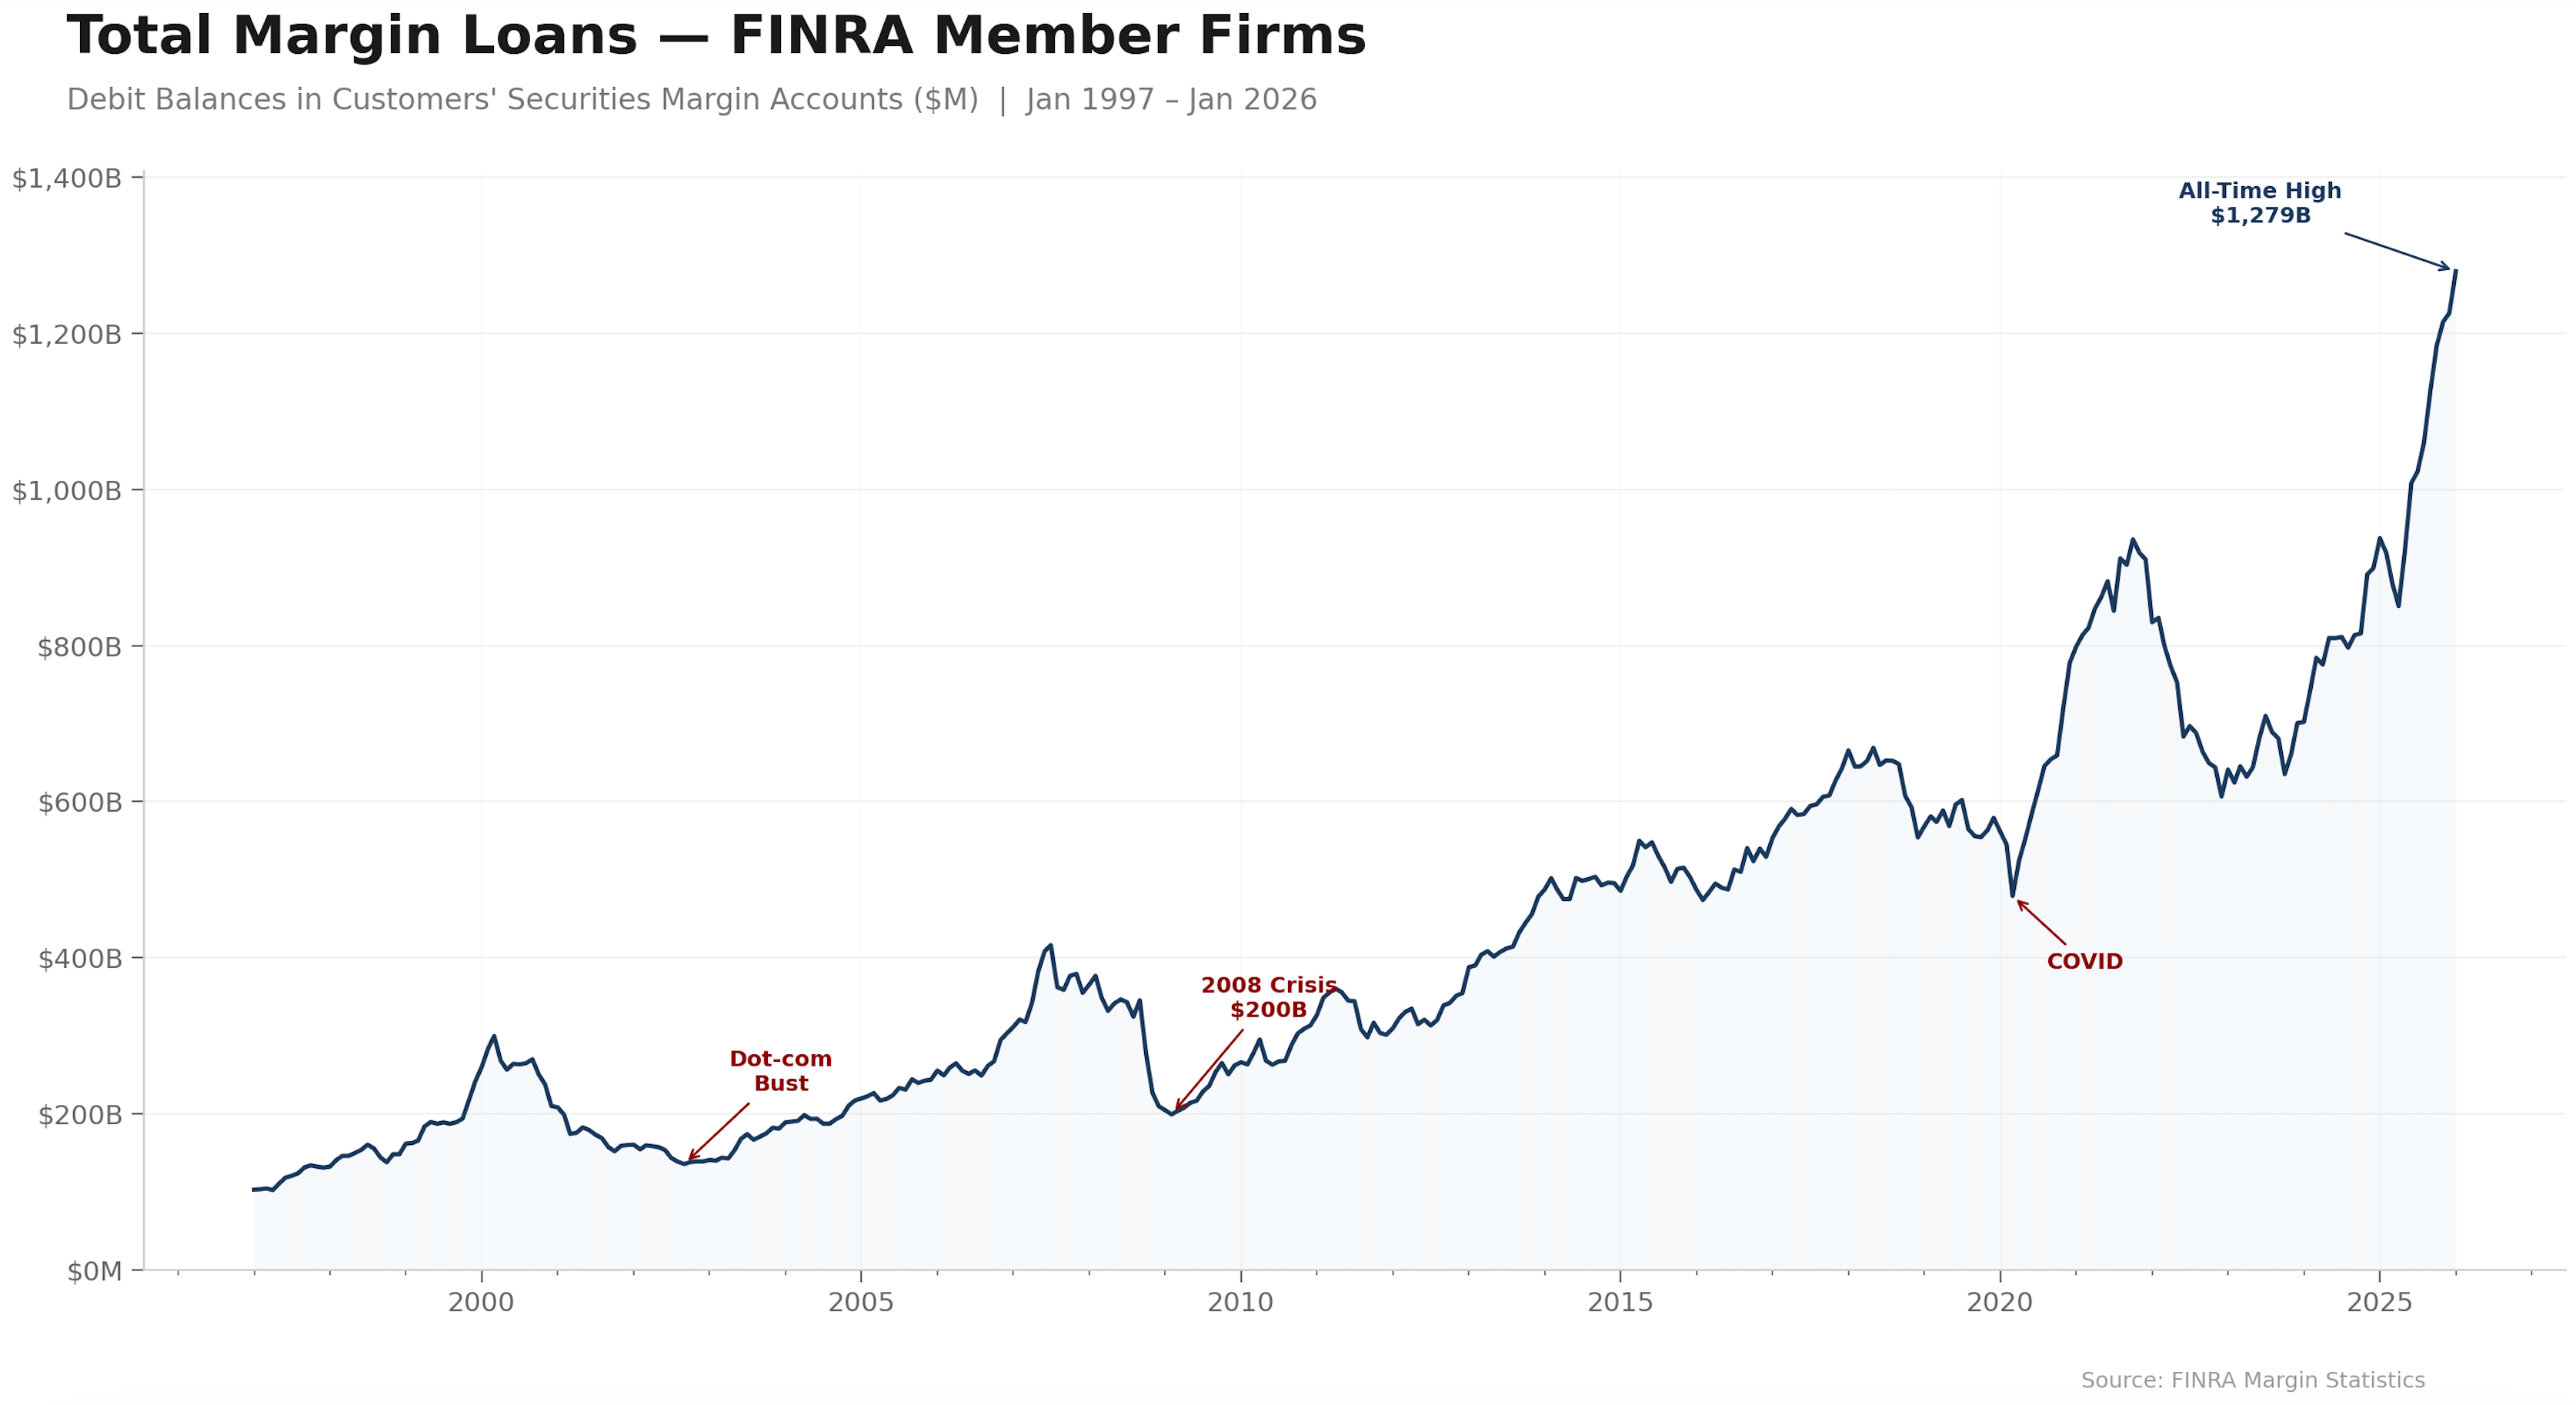
According to the latest FINRA data, margin balances are now approaching $1.3 trillion. That capital has to be deployed into assets expected to generate returns well above the cost of debt. So where is it going? Which assets are absorbing all of this leverage? You can probably guess.
By examining the increase in margin debt in the US, together with market performance and concentration over the past 3 years, it becomes increasingly evident where leverage has accumulated and which areas are most likely to be facing stretched valuations as a result.
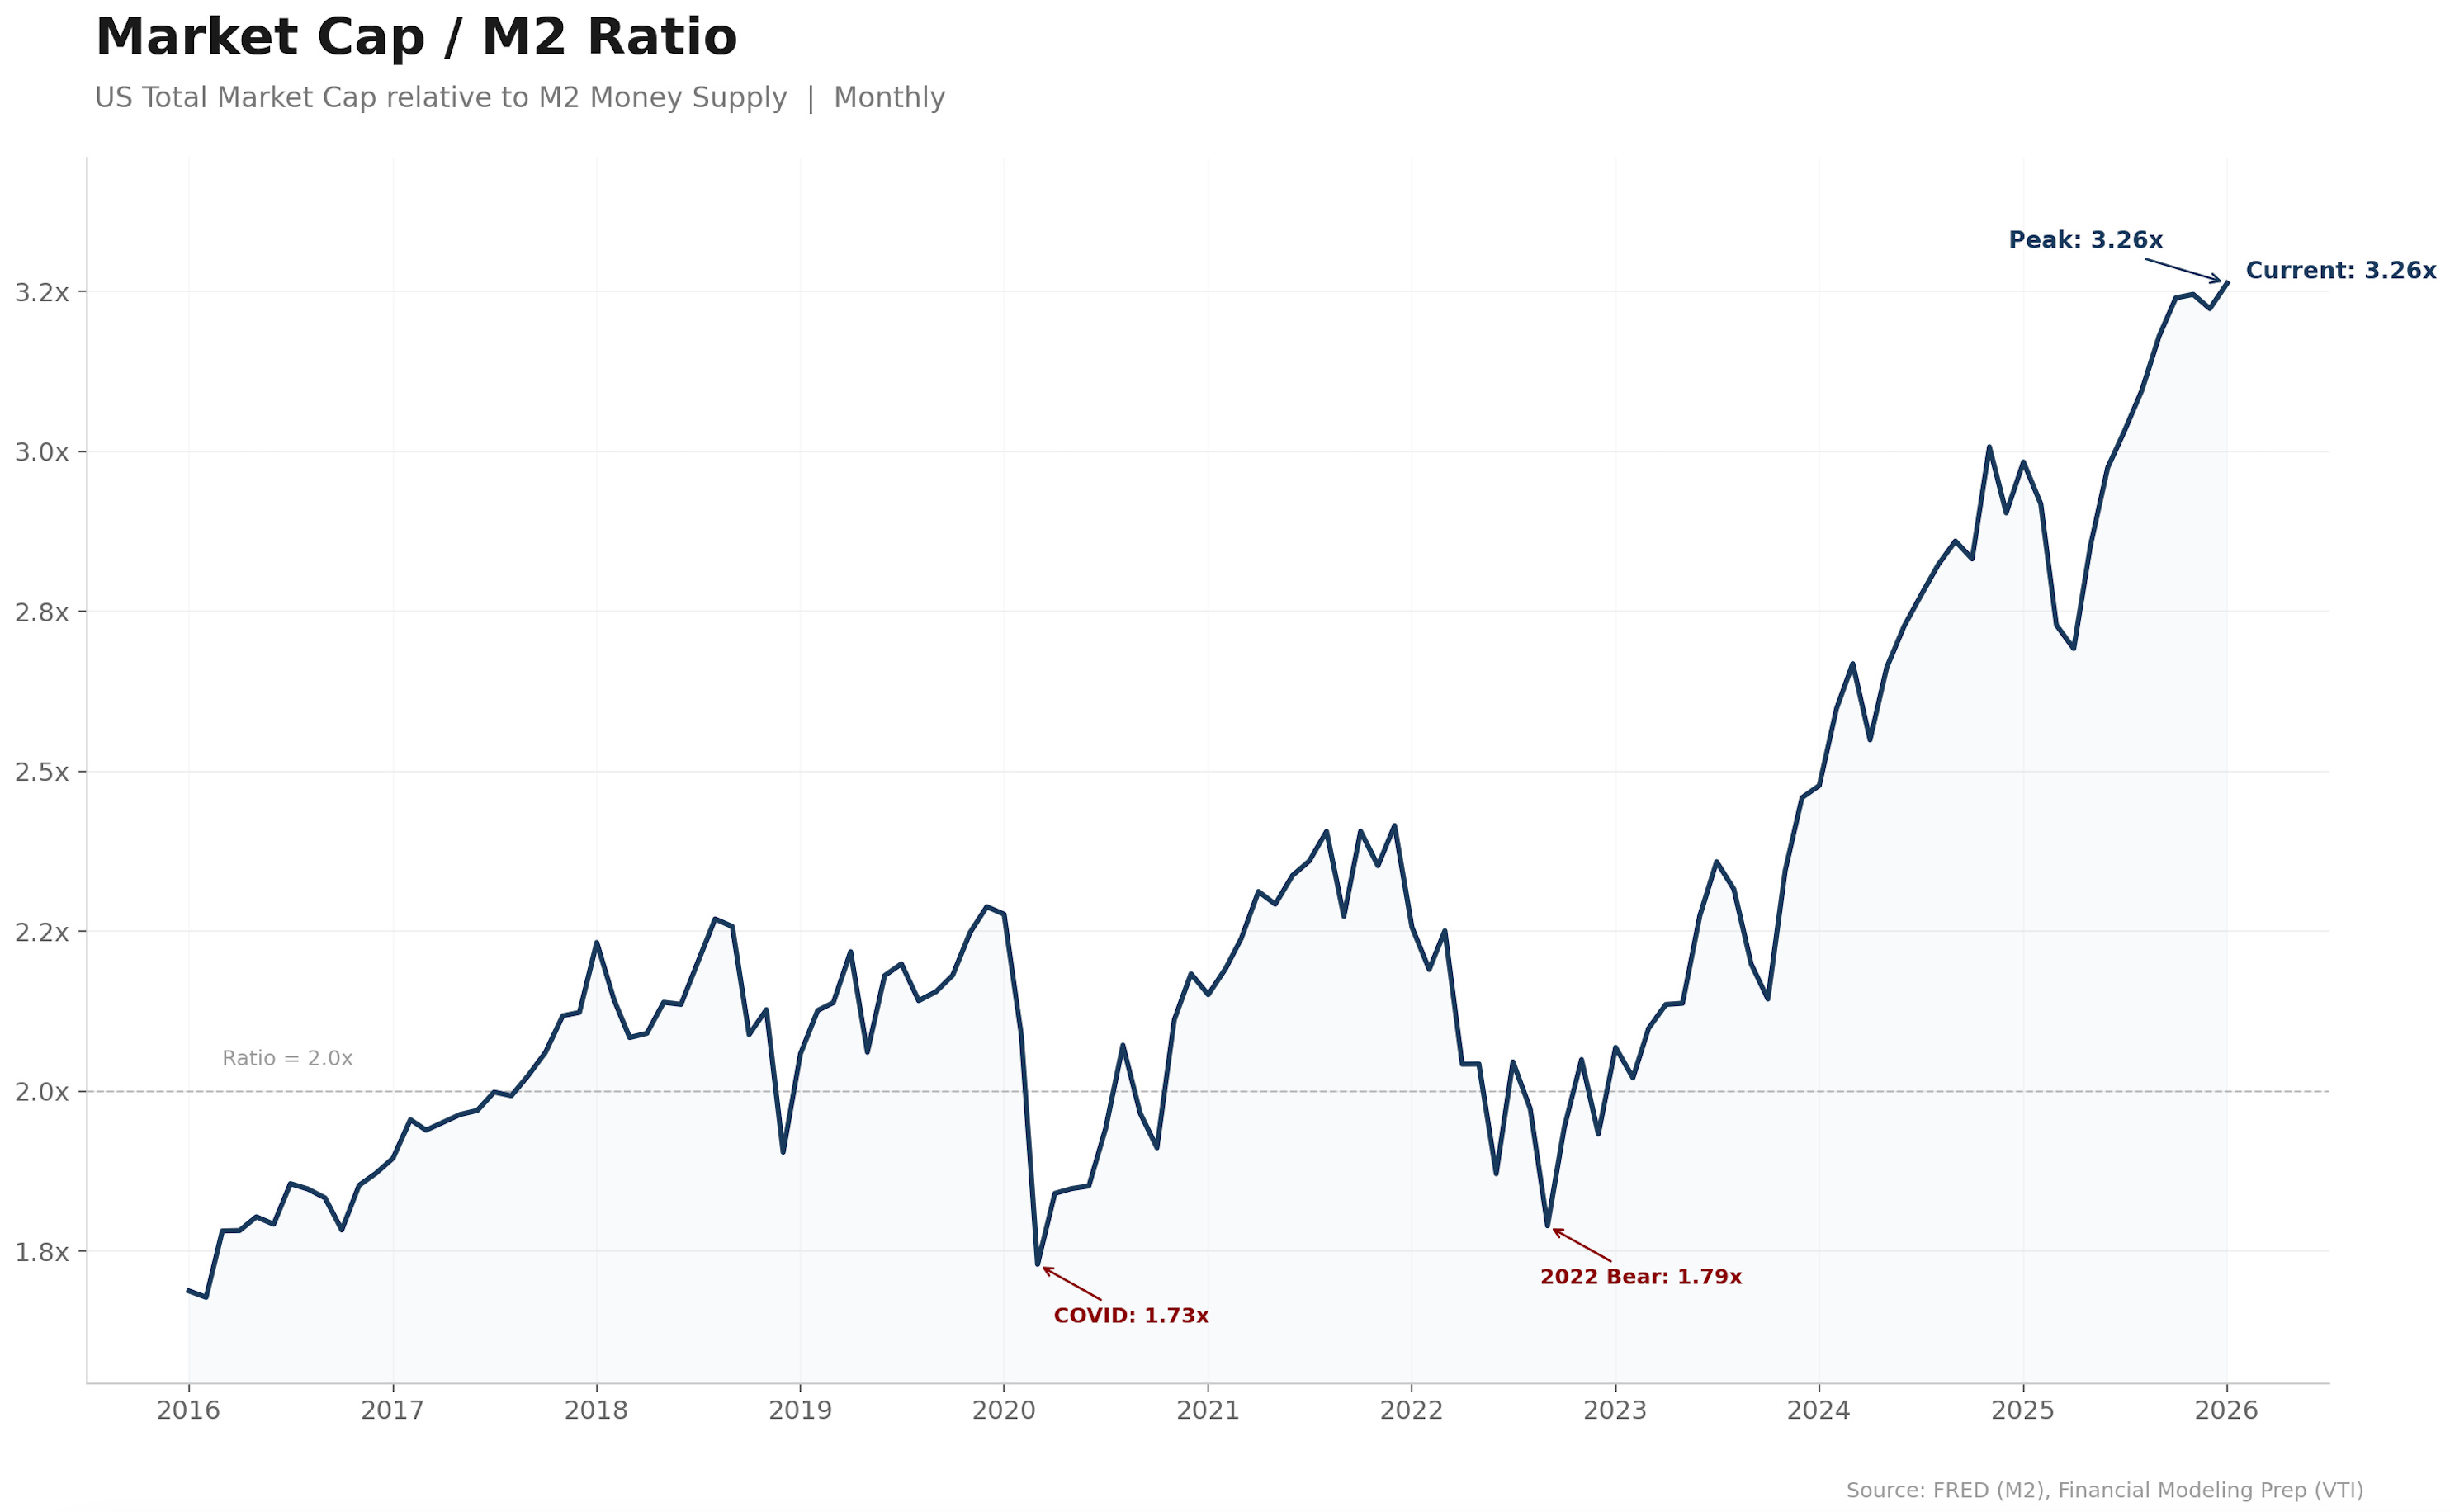
My argument is no longer based solely on valuations. It now also depends on the relationship between the amount of capital in the system and total market capitalisation. As we can see, the divergence between total US stock market capitalization and M2 has never been greater, either in relative or absolute terms.
